Bank Merger and Acquisition Activity [White Paper]
Key Takeaway
We are a leading provider of bank merger fair value determinations, providing us with deep insight and knowledge of the marketplace. Nationally recognized experts, we combine sophisticated financial expertise with a thorough understanding of the required accounting and have led trainings on the subject for the FDIC. Our white papers have been downloaded thousands of times.
How Can We Help You?
Founded in 2003, Wilary Winn LLC and its sister company, Wilary Winn Risk Management LLC, provide independent, objective, fee-based advice to over 600 financial institutions located across the country. We provide services for CECL, ALM, Mergers & Acquisitions, Valuation of Loan Servicing and more.
Released September 2024
Introduction
The banking industry has faced numerous challenges over the past few years resulting in a historically low number of mergers and acquisitions. While there is some optimism regarding a bounce back in deals in 2024 and 2025, headwinds remain which may temper expectations of increased merger and acquisition activity.
This white paper provides readers with an overall perspective of the banking merger and acquisition marketplace. The data includes industry-wide information on bank mergers and acquisitions since 2000, with a specific focus on the last three years. We also discuss the primary drivers of the decreased activity experienced in recent years and conclude with our thoughts on the future of bank mergers and acquisitions.
We are frequently asked about bank merger and acquisition activity. Wilary Winn serves over 600 financial institutions, including 73 that are publicly traded. We have performed over 600 merger engagements since 2009, ranging in size from $2M to as large as $3B in total assets. Our work in this area allows us to be highly informed on the bank merger and acquisition marketplace.
This white paper is the first in a planned series of ongoing updates. In this paper, we recap activity through September 19, 2024, including the effects of COVID-19 and the subsequent recovery. We detail the primary factors impacting deal activity in recent years and conclude with our thoughts on where we believe the bank merger and acquisition marketplace is headed over the next few years.
In this post, you will find industrywide information about the:
- Number of bank mergers and acquisitions
- Number of credit union acquisitions of banks
- Average pricing multiples
- Relationship between profitability and multiples
- Key drivers of the recent decrease in the number of transactions and price-to-tangible book multiples
If you are interested in more details about a specific topic, please let us know.
Industry Merger Statistics
The following chart tracks the number of bank mergers and acquisitions that have been announced each year since 2000. As shown, bank merger and acquisition activity has typically been above 200 transactions per year, except for 2008 through 2011 due to the great recession. The number of transactions fell in 2020 due to the COVID-19 pandemic but increased to more normalized levels in 2021. Transactions fell again during 2022 and 2023, and through September 19, 2024, there had been 87 announced transactions, which puts 2024 on pace to fall between 2022 and 2023.
We attribute the decline in transactions in recent years to a variety of factors, including a disconnect on pricing between buyers and sellers, large unrealized losses on investment securities, a smaller pool of potential sellers, weakening economic conditions and profitability, and increased regulatory scrutiny. Further discussion on the decline in the number of transactions is discussed in detail later in this white paper.
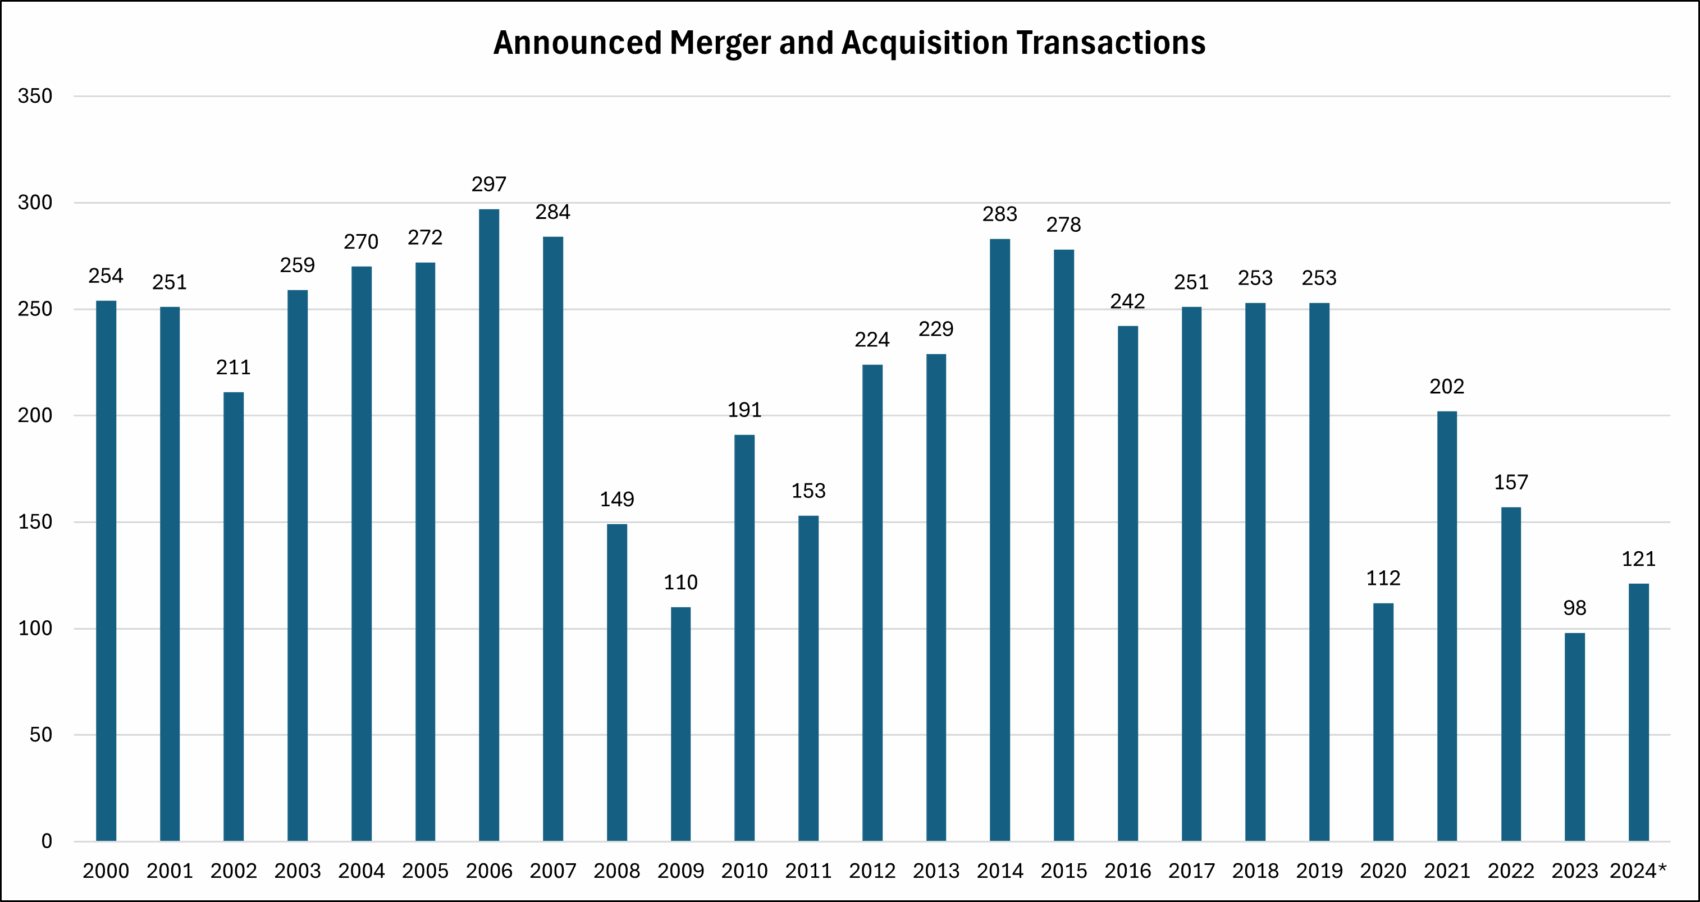
All bank and savings bank transactions located in the United States announced between December 31, 1999, and September 19, 2024.
*2024 is annualized. Through September 19, 2024, there had been 87 transactions.
Wilary Winn works with both banks and credit unions. In the past, credit union acquisitions of banks were relatively uncommon; however, credit unions are now a key player in the bank acquisition marketplace, as evidenced by the following chart. Although the number of actual transactions historically is quite small relative to the number of mergers and acquisitions that take place each year, this trend has become a hot topic in the industry. We note that the 14 announced deals in 2022 were an all-time record. Moreover, the 11 announced deals in 2023 are equal to 11.2% of the announced total transactions – a record high for the credit union industry.
We expect this trend to continue, as there have already been 15 announced deals through September 19, 2024. Further detail surrounding the strategic, tax, and regulatory considerations concerning these types of transaction can be found in our white paper titled Credit Unions Purchasing Community Banks.
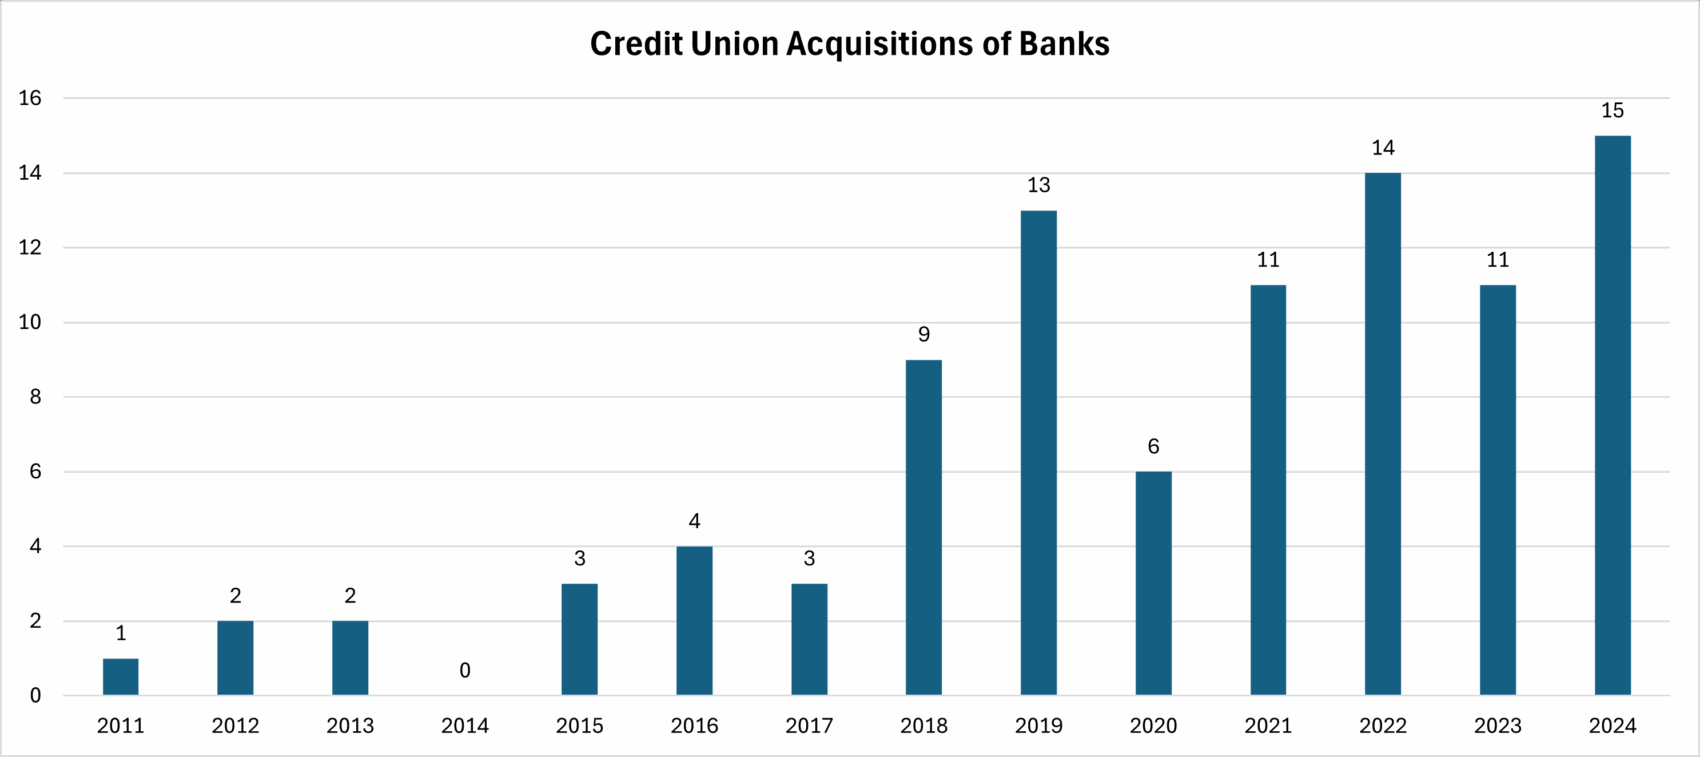
All credit union acquisitions of banks located in the United States announced between December 31, 2020, and September 19, 2024.
The average price-to-tangible book value (“P/TBV”) multiple by year for all bank transactions is shown in the table below. We note that the P/TBV multiple is the price paid or consideration provided by the buyer to the seller of the bank divided by the tangible book value. Following peak P/TBV multiples paid in the early 2000s, the P/TBV decreased significantly during the great recession. Thereafter, the average P/TBV multiple steadily recovered through 2019 before decreasing again in 2020 due to the COVID-19 pandemic. We note that the average P/TBV multiple has compressed further in 2023 and 2024.
We attribute the decline in the P/TBV in recent years to compressed publicly traded bank stock prices coupled with unprecedented levels of unrealized losses of investment securities. Further discussion on the decline in the P/TBV is discussed in detail later in this white paper.
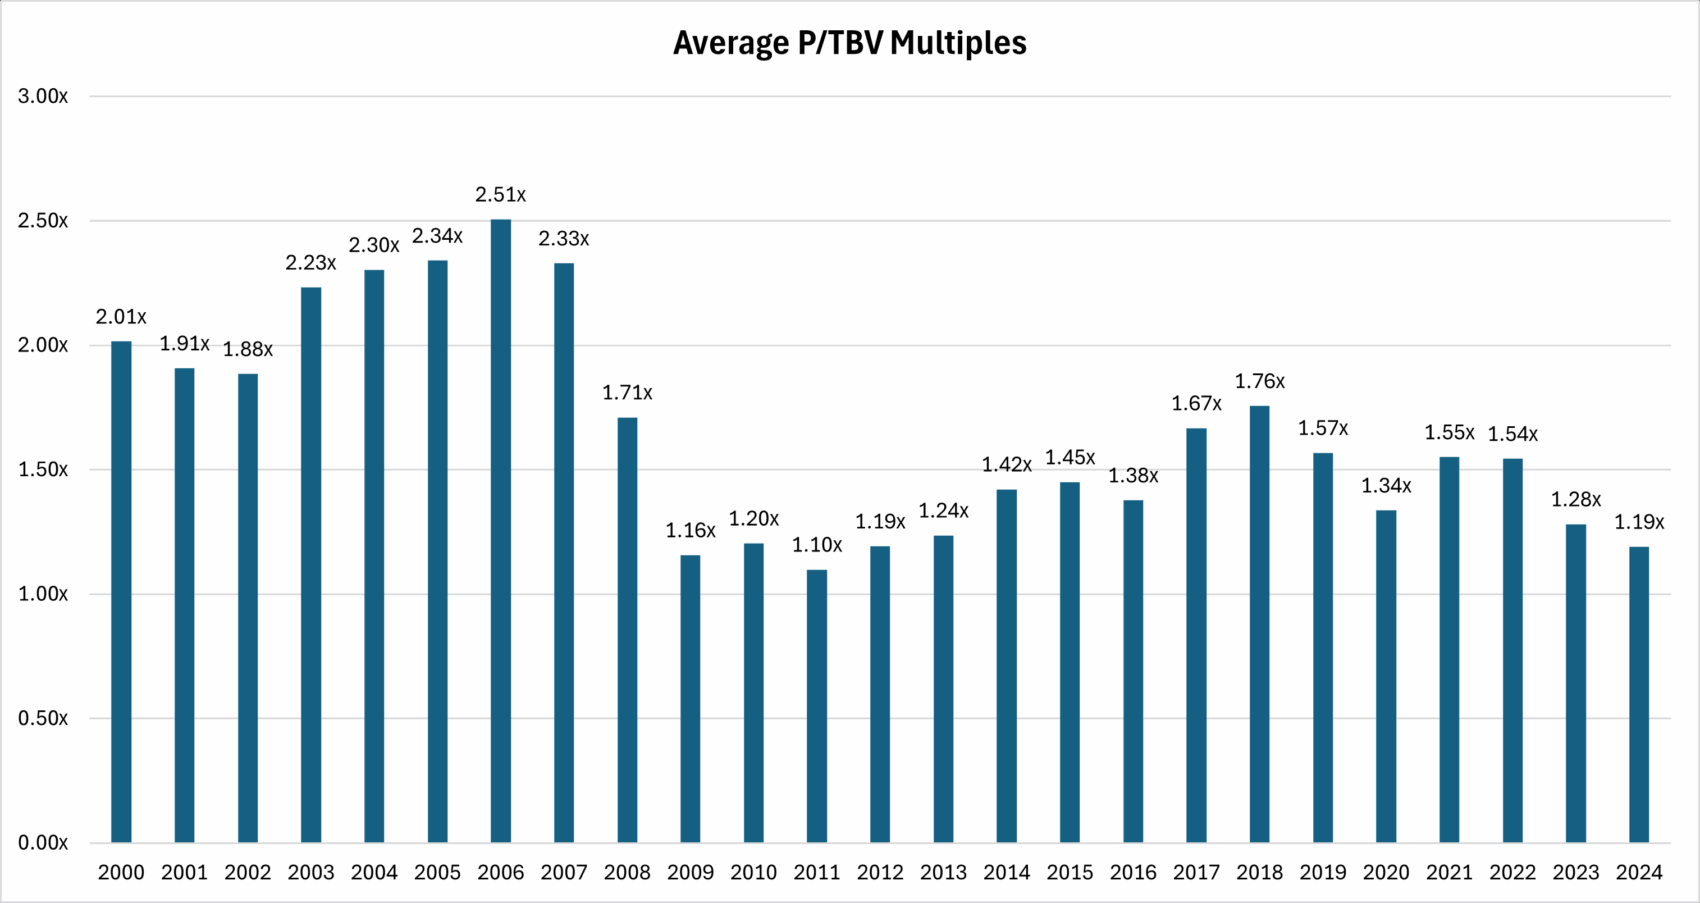
All bank and savings bank transactions located in the United States announced between December 31, 1999, and September 19, 2024.
Given the slowdown in deals and compressed premiums in the market, we further analyzed the relationship between the P/TBV paid and the size of the target institution, as shown in the table below. For all deals where the target institution is less than $1B in total assets, there is a strong positive correlation between the asset size of the target institution and the P/TBV paid. However, the table below shows that the average P/TBV decreases when the target institution is greater than $1.0B in total assets. In instances where the target institution is greater than $1.0B in total assets, it is likely that a large portion of these deals are mergers of equals (“MOEs”).
In an MOE, emphasis is typically placed on combined institution benefits (build scale, improve efficiencies, overcome regulatory pressures, etc.), as compared to focusing on a high premium paid. As a result, MOEs have increased in frequency in 2023 and 2024, as small to mid-size banks are better able to justify these deals with relatively lower prices.

Additionally, the following chart shows the average price-to-last twelve-month (“P/LTM”) earnings multiple by year for all bank mergers and acquisitions since 2000. We note that the P/LTM multiple is the price paid or consideration provided by the buyer to the seller of the bank divided by the institution’s last-twelve-months earnings. We note that the P/LTM earnings multiples have been relatively lower over the past six years, as compared to the relatively higher multiples paid prior to 2019.

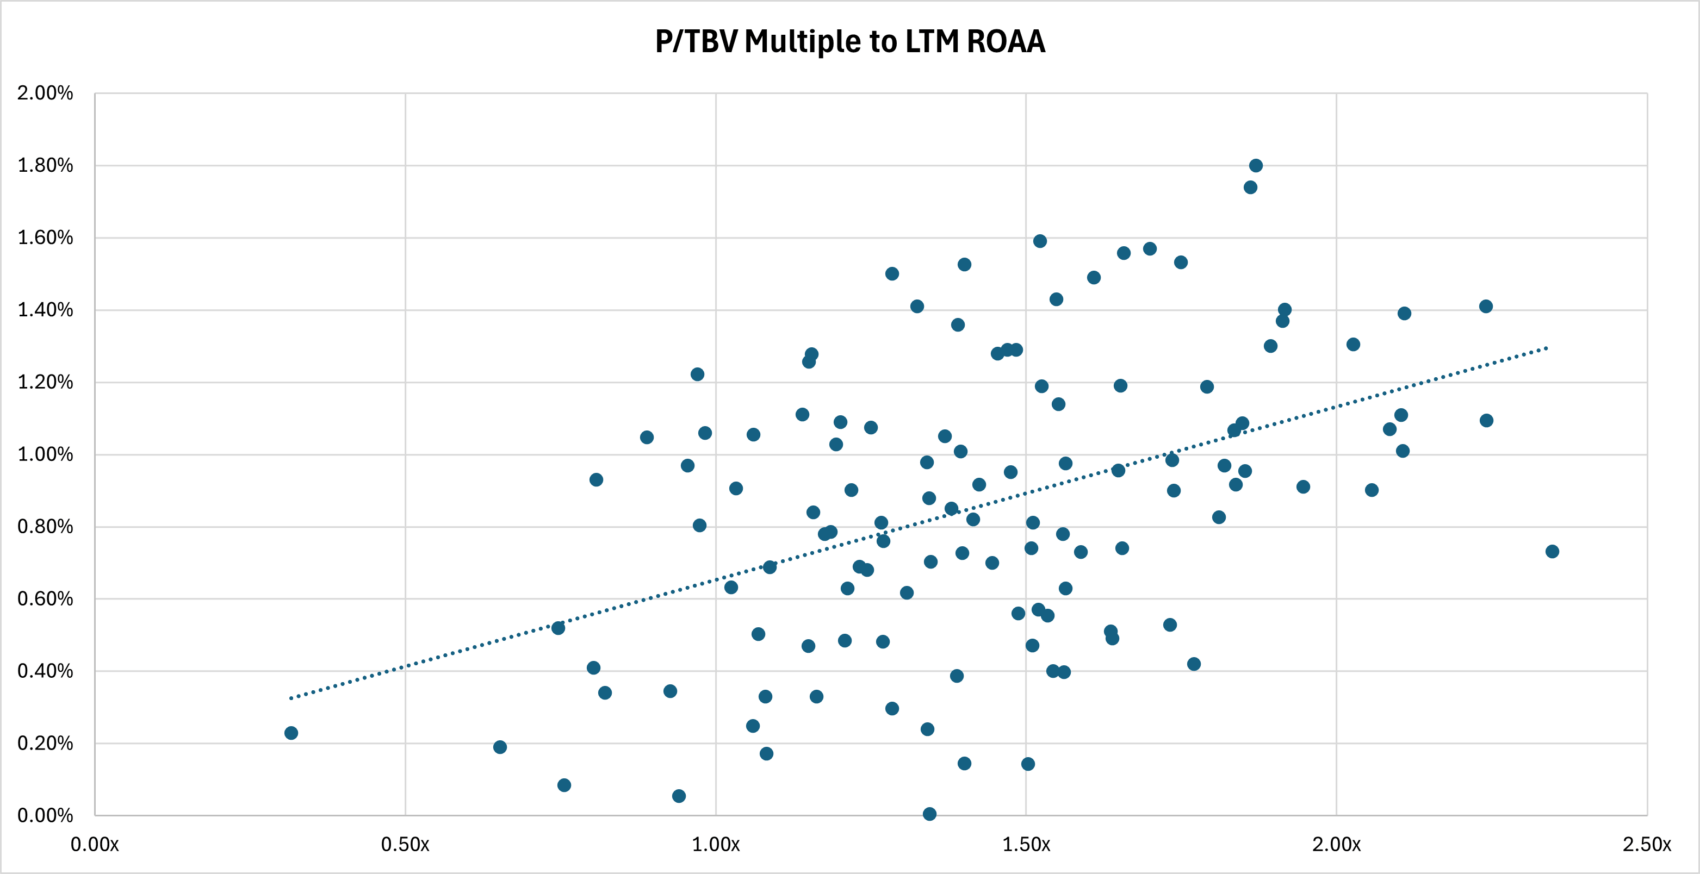
We note that there is a positive correlation between the P/TBV multiples and profitability. Conversely, we note that there is a negative correlation between P/LTM earnings multiples and profitability. These are exhibited in the following charts, which reflect transactions announced between December 31, 2021, and September 19, 2024.
Not surprisingly, this correlation indicates that deal values tend to be higher for institutions with strong profitability. In aggregate, return on average assets (“ROAA”) has decreased across the banking industry from a five-year peak of 1.23% in 2021 to 1.01% in 2024. This reduced profitability has directly contributed to lower premiums in the market, as discussed in detail later in this white paper.

Key Drivers of Deal Activity
As discussed in the previous section, there has been a pronounced decrease in the number of transactions and the P/TBV multiples paid over the past few years. This is driven by a variety of factors.
- Disconnect on Pricing between Buyers and Sellers
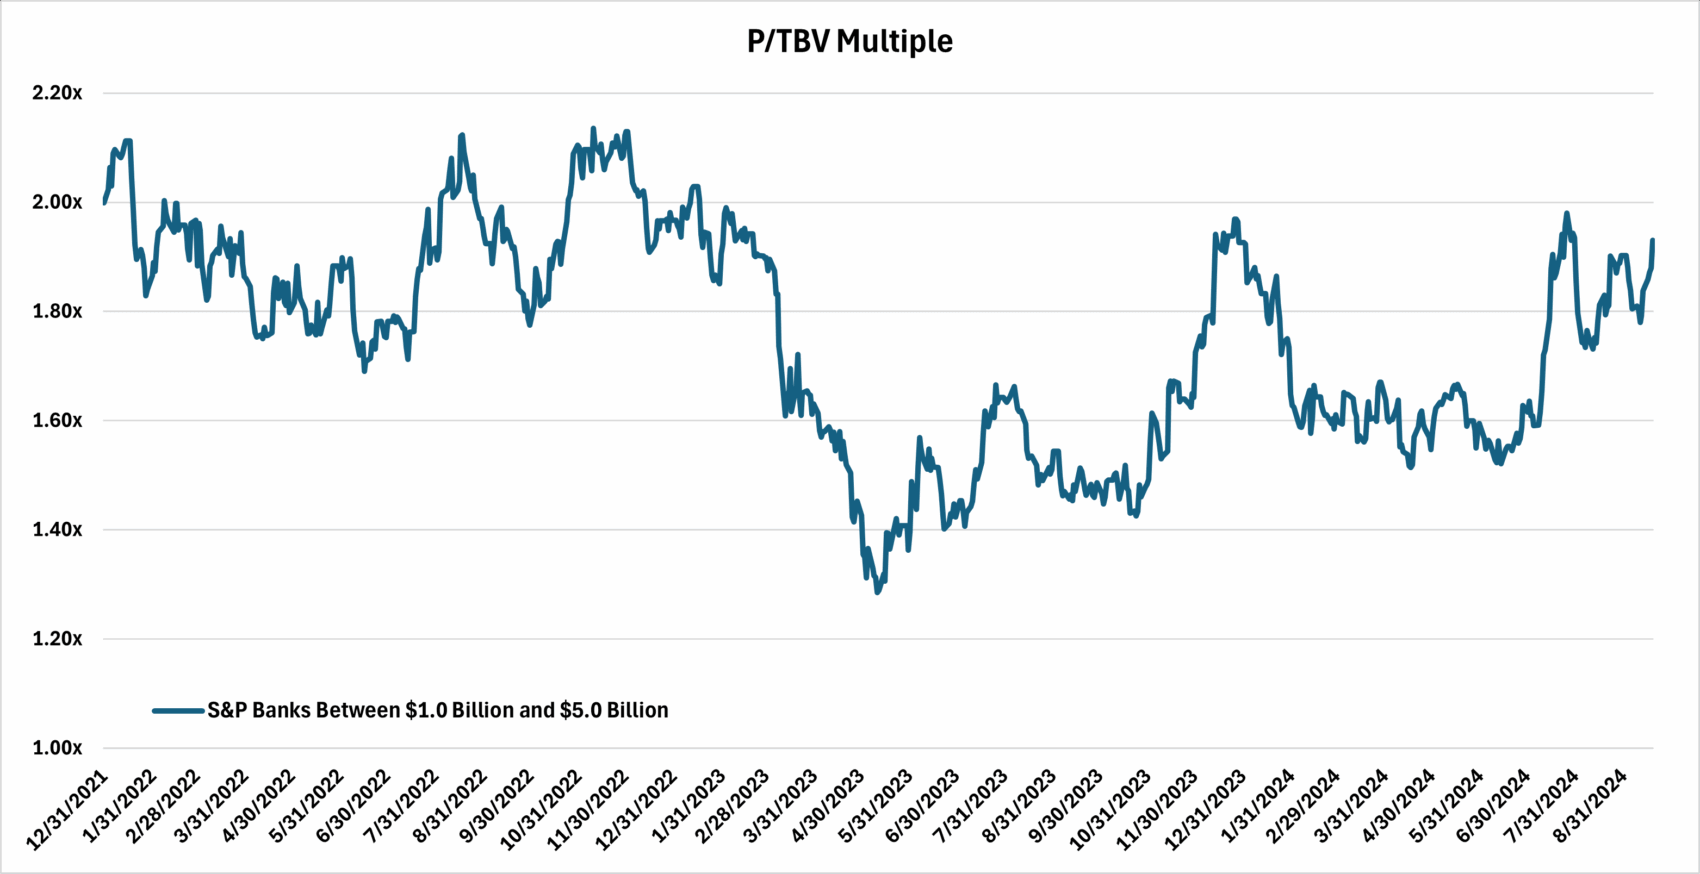
There are typically two differing forms of consideration in a bank acquisition: cash or stock. In recent years, we have seen a shift to banks using stock as the primary form of consideration in larger deals. As a result, we analyzed P/TBV for the S&P Banks Between $1.0 billion and $5.0 billion Index, as shown in the following table. The P/TBV multiple generally decreased from 2.00x as of December 31, 2021, and averaged 1.69x during 2024. However, the P/TBV recently increased to 1.93x as of September 19, 2024, following the Federal Reserve’s decision to decrease the federal funds target rate by 50 basis points in September of 2024.
Historically, sellers have typically negotiated for P/TBV multiples of 1.50x or greater, as shown previously in this white paper. In transactions in which the acquiring bank uses its stock as currency, the stock devaluation of the past few years shown below significantly limits the amount that buyers are willing to pay due to shareholder and tangible book dilution.
As a result, the pool of prospective buyers has been limited in the current environment due to P/TBV dilution.
- Uncertainty in Deal Pricing due to Large Unrealized Losses on Investment Securities
Due to rising interest rates in 2022 and 2023, banks have unprecedented levels of unrealized losses on investment securities, as shown in the table below.
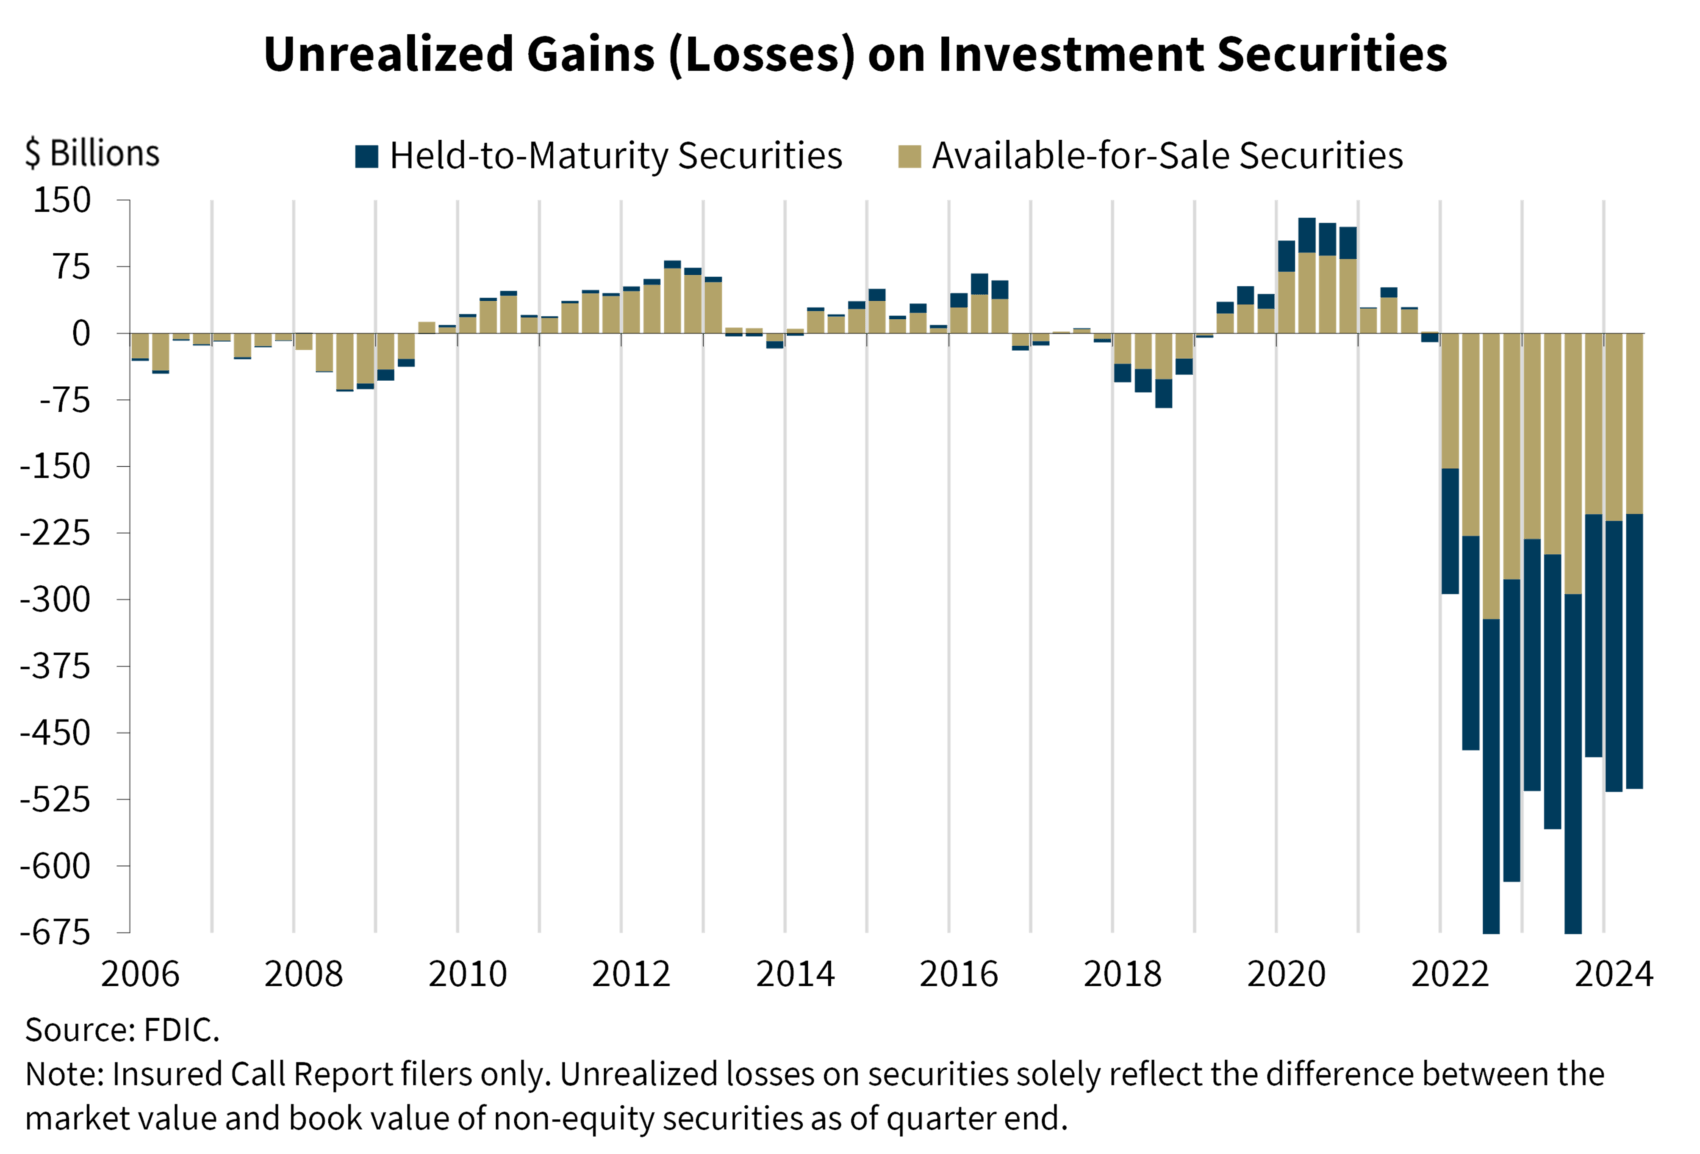
Unrealized losses on available-for-sale investment securities are reported in Accumulated Other Comprehensive Income (“AOCI”) and are excluded from regulatory capital ratios. Thus, while this issue is of concern to management teams, particularly in the event of stress on liquidity, the large negative effects of these losses do not significantly impact banks if these investments continue to be held. In the event of a sale of investments, these losses are then realized through net income and would directly decrease regulatory capital. Furthermore, the sale of a bank requires institutions to follow Business Combination (Topic 805) accounting, whereby the acquired institution is recorded at fair value. These unrealized losses are ultimately captured in goodwill, which is a deduction in regulatory capital for the acquiring institution.
Most acquiring institutions are relatively averse to recording large amounts of goodwill through a transaction. Therefore, the discrepancy in how these large unrealized losses is taken into consideration for regulatory capital for the selling institution versus the acquiring institution creates difficulty when negotiating a price for the transaction.
- Smaller Pool of Potential Sellers
While the pace of merger and acquisition activity has slowed, industry consolidation continues, as evidenced in the table below.
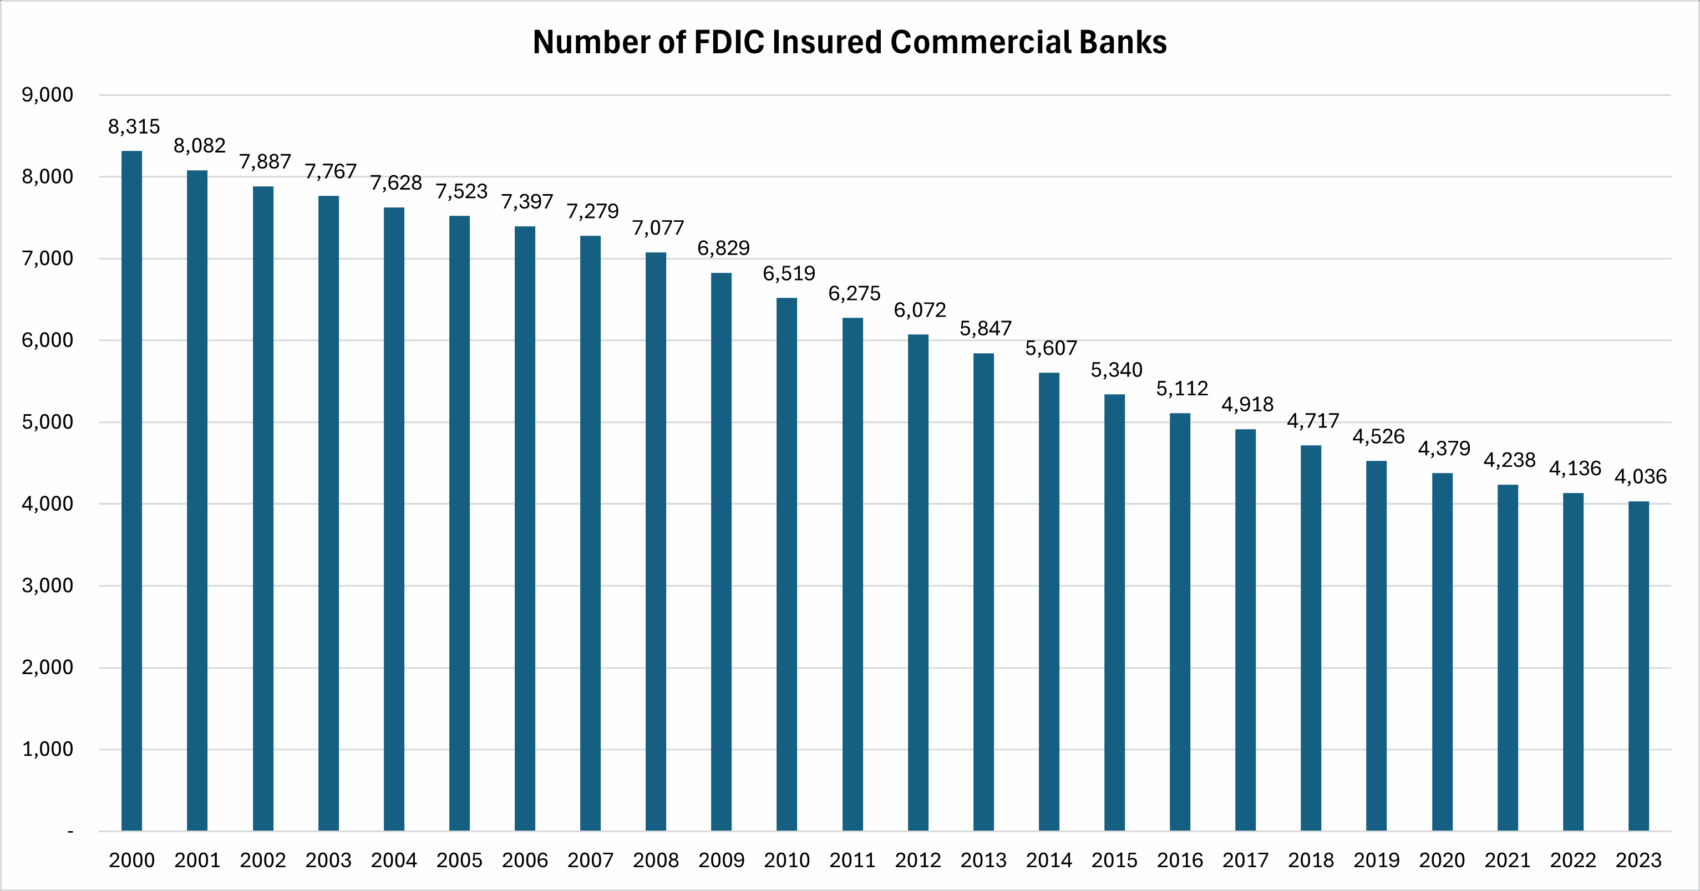
As shown in the following chart, prior to the great recession, de novo activity offset some of the decrease in bank charters due to mergers, acquisitions, and failures; however, de novo activity has essentially evaporated since the great recession due to increased regulatory scrutiny and higher capital requirements. S&P Capital IQ notes that there has only been one de novo bank established thus far in 2024.

Thus, the number of deals experienced in recent years and expected on a go-forward basis will likely be lower than historical averages due to a smaller pool of sellers (due to consolidation) coupled with few new entrants to the banking industry.
- Weakening Economic Conditions and Profitability
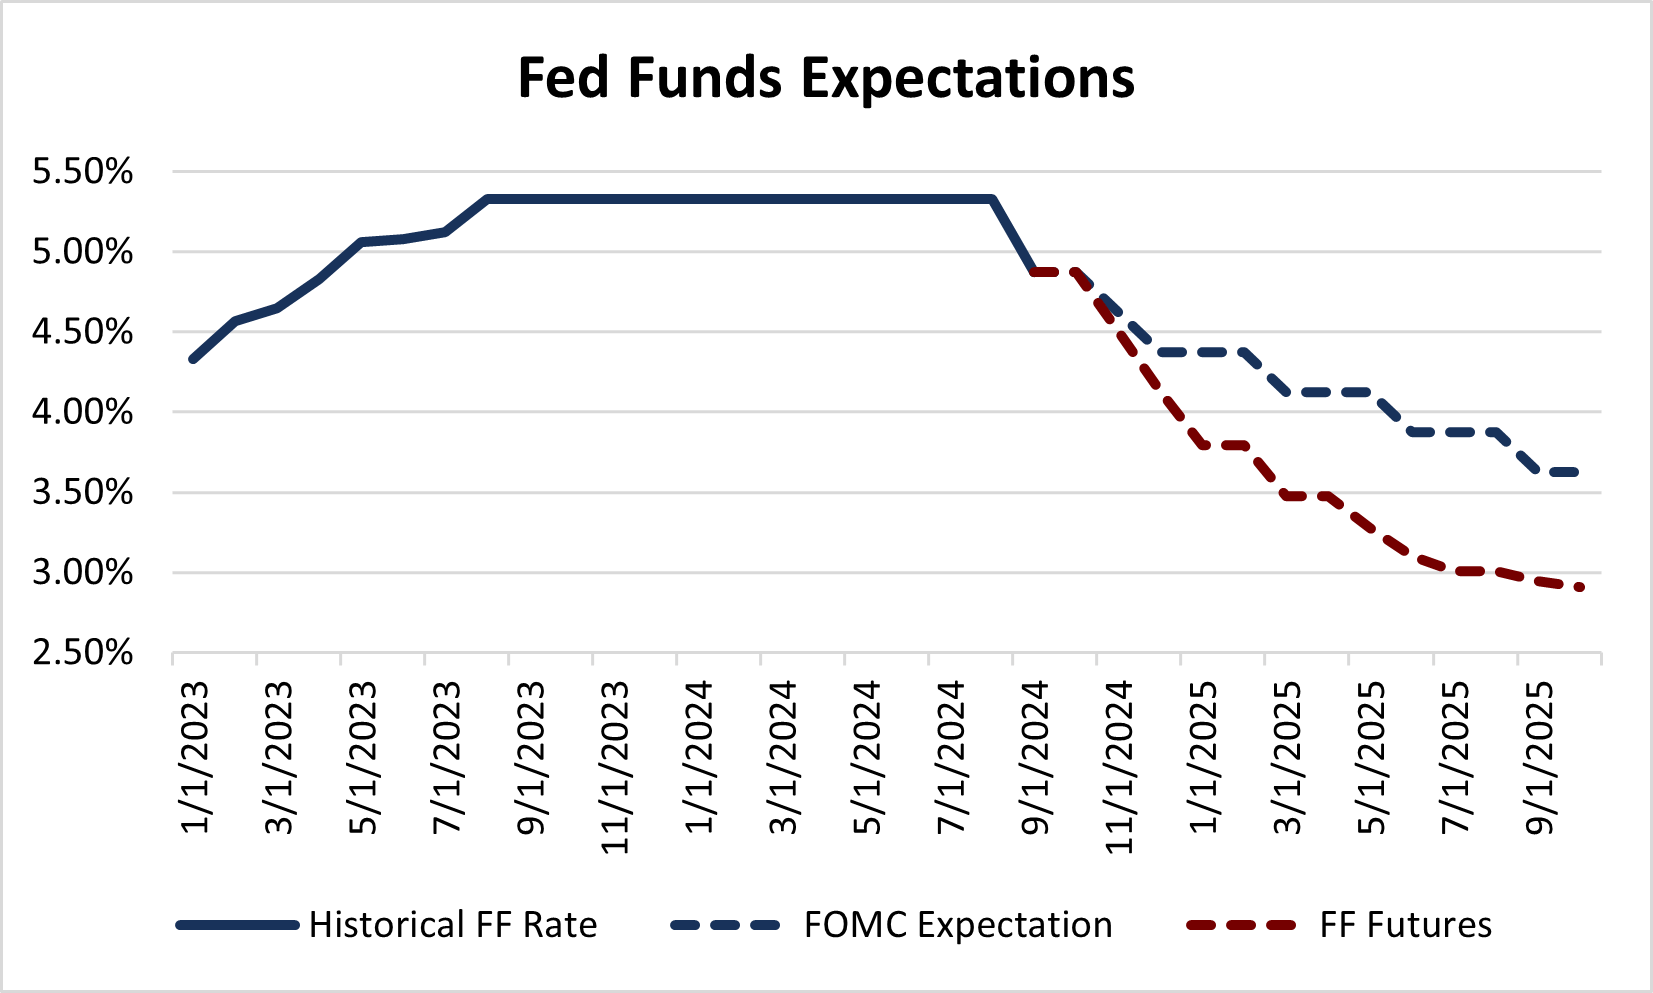
Economic uncertainty has persisted since the end of the COVID-19 pandemic. In response to elevated inflation readings, the Federal Reserve raised the federal funds target rate from 0.25% to 0.50% at the end of 2021 to 5.25% to 5.50%. These rate increases were expected to put downward pressure on inflation, and while it has, it has taken longer than many expected and resulted in higher interest rates for a longer period. While the Federal Reserve has been hesitant to cut rates at the risk of inflation increasing again, and economic indicators have not significantly deteriorated, the Federal Reserve did make the decision to cut rates by 50 basis points at its meeting on September 18, 2024. Furthermore, recent readings suggest that inflation is moving towards the Federal Reserve’s 2.00% target, and some sources are projecting further rate decreases through the end of the year, as shown in the following chart.
Prolonged inflation over the last few years has resulted in significant deposit outflow across the banking industry, although deposit growth has slightly rebounded in the first six months of 2024. As a result, banks have increasingly turned to higher-cost funding sources to protect against further deposit attrition, which has compressed net interest margin across the industry. Furthermore, banks continue to contend with higher provision expenses related to commercial real estate concerns and the increased volatility associated with the Current Expected Credit Loss (“CECL”) standard.
The earnings pressures described above coupled with the ongoing threat of a recession over the past few years have reduced profitability for the banking industry and tempered bank merger and acquisition activity. Banks have instead shifted focus to in-house cleanup and ensuring the institution is best positioned for interest rate movements and potential asset quality issues caused by weakening economic conditions.
- Regulatory Scrutiny
The year 2023 was a volatile year for banks. There were five bank failures in 2023, the most in a single year since 2017. As a result, increased scrutiny and regulation on banks and bank mergers and acquisitions is expected to continue. In particular, Merger Guidelines were jointly issued in 2023 by the Federal Trade Commission and Justice Department. The Office of the Comptroller of the Currency (“OCC”) issued a final rule in 2024 related to its regulations of business combinations involving national banks and federal savings associations. Lastly, the Federal Deposit Insurance Corporation (“FDIC”) approved its final Statement of Policy on Bank Merger Transactions in September of 2024.
These rules are expected to lengthen the approval process and remove expedited review procedures related to bank merger and acquisition activities.
Looking Forward
While future merger and acquisition activity remains uncertain, we expect to see the number of transactions move closer to historical levels. We believe the following trends will drive the bank merger and acquisition marketplace over the next few years.
- Despite projected rate cuts, we expect interest rates to remain relatively high over the next year, creating challenges in maintaining core deposits. As a result, we anticipate smaller institutions will continue to struggle to grow and will ultimately seek acquisition partners due to the higher percentage of regulatory costs to total costs incurred in operating a small financial institution.
- Asset quality will come back to the forefront following several years of unusually low delinquencies and net charge-offs driven by government assistance during the pandemic. In particular, banks with high concentrations in commercial real estate (“CRE”) are likely to experience rising levels of nonperforming loans as CRE property values fall and these loans come due in the next few years. Institutions with the most concentrated CRE exposures and insufficient capital may need to be acquired if these portfolios incur significant losses.
- The pandemic accelerated the shift of many customers to digital banking and highlighted the need for strong technological solutions. However, banks often lack the resources to adequately meet the technology requirements of their customers. As a result, many institutions will seek to be acquired by institutions with superior technology and the resources required to offer the electronic banking demanded in the marketplace.
- We expect to continue to see an increase in the number of mergers of equals. Banks of moderate size view the opportunity to merge as a means to quickly achieve economies of scale to better compete in the ever-evolving financial services industry.
- While credit union purchases of banks are expected to continue, these transactions face regulatory headwinds as banking trade associations continue to push back on these deals. Additionally, the FDIC included in its new bank merger policy statement that the agency will request additional information in credit union acquisitions of banks since credit unions are not subject to the Community Reinvestment Act (“CRA”).