CECL and Credit in Recession [White Paper]
Key Takeaway
Early warning signs—like unemployment and credit shifts—can help predict losses. Wilary Winn’s CECL model helps lenders stay ahead of the curve.
How Can We Help You?
Founded in 2003, Wilary Winn LLC and its sister company, Wilary Winn Risk Management LLC, provide independent, objective, fee-based advice to over 600 financial institutions located across the country. We provide services for CECL, ALM, Mergers & Acquisitions, Valuation of Loan Servicing and more.
Released May 2025
Introduction
This white paper explores the leading and lagging indicators of a recession, examines the impact of the previous recession on credit quality and financial institutions’ loss reserves, and considers how a future recession could affect these areas today.
Additionally, it highlights how Wilary Winn’s Current Expected Credit Loss (CECL) model integrates economic indicators to dynamically adjust for potential future environments. For illustrative purposes, residential real estate loans will serve as the primary example throughout this analysis.
Background of the 2008 Recession
The 2008 financial crisis caused major disruptions across the financial sector and triggered a global economic downturn known as “The Great Recession.” The crisis was largely driven by the collapse of the housing bubble and a sharp rise in defaults on subprime mortgages. Many financial institutions had heavily invested in non-agency mortgage-backed securities (MBS) and collateralized debt obligations (CDOs), which were tied to the performance of the housing market. When home prices began to fall, the value of these investments and the institutions’ own single family mortgage portfolios dropped significantly, leading to major losses.
As losses mounted, several institutions faced insolvency due to their exposure to these assets and high levels of leverage. The situation escalated into a broader liquidity crisis as confidence in the financial system eroded, making it much harder for banks, businesses, and consumers to access credit. With credit tightening, many companies were forced to cut spending and lay off workers. The unemployment rate rose sharply as millions of Americans lost their jobs. This further weakened the housing market, leading to a surge in foreclosures and a further decline in home values.
Rapidly falling property prices pushed many homeowners into negative equity or owing more on their mortgages than their homes were worth. As incomes declined and loan defaults increased, banks saw unprecedented mortgage-related losses. By some estimates, total loan losses for loans originated by US financial institutions peaked at more than $1.6 trillion, highlighting the scale of the financial system’s vulnerability to housing market risk and excessive leverage.
Recession Leading and Lagging Indicators
When evaluating the onset or progression of a recession, economic indicators serve as essential tools for interpreting shifts in financial health at both the consumer and macroeconomic levels. Among these indicators, FICO scores, loan-to-value ratios (LTVs), unemployment rates, and the yield curve each provide unique insights—ranging from lagging signs of economic strain to early warnings of broader systemic risks. While no single metric can definitively predict a recession, a holistic view of these indicators reveals patterns that can help lenders prepare for potential downturns.
FICO Scores
FICO scores are often used as an indicator when assessing the risk of a recession, as they reflect the creditworthiness of borrowers. A downward trend in aggregate FICO scores can signal deteriorating consumer credit health and potentially foreshadow an economic downturn. One of the ways to visualize the impact to consumer creditability during the 2008 recession is through a FICO migration analysis. FICO performed this kind of analysis in late 2011, looking at distributions of FICO scores and their movement in three consecutive years from 2008 to 2011. The following chart displays the results of the analysis:
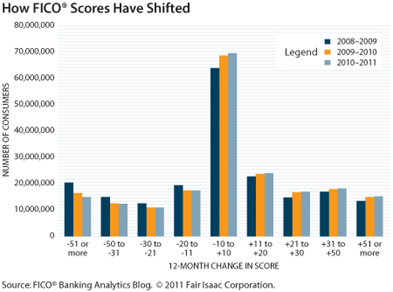
As shown in the previous chart, for 2008-2009, approximately 50 million people had scores decline by more than 20 points, and of those, nearly 40% declined by more than 50 points. As years progressed, fewer and fewer borrowers had scores migrate negatively and more began to improve, a reversion back to long-term averages. During 2010-2011, the scores of around 49 million people increased by 20 points or more. Per the FICO report, “it is a natural consequence of people treating credit more carefully in a time of uncertainty.”
There are instances where trends in FICO score movements can be misleading. For example, at the beginning of 2020, the average FICO score was 703, but by October it had risen to 711, as shown in the table below.
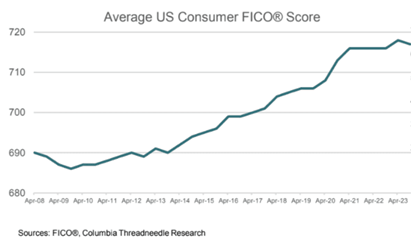
One might assume that most borrowers were financially healthy, and that the economy was thriving – yet this was during the peak of the COVID-19 pandemic. At the time, millions of Americans had lost their primary sources of income, and the National Bureau of Economic Research had officially declared a recession. Despite these challenges, FICO scores were actually improving. This apparent contradiction was largely due to massive stimulus programs and relief measures implemented by government agencies and lenders. The stimulus payments helped borrowers stay current on their debt obligations, while widespread payment deferrals by lenders contributed to a decline in reported delinquencies.
LTVs
While FICO scores are generally considered to be a lagging indicator of a recession (scores do not immediately respond to economic downturns and it takes time for people to accumulate debt, miss payments or default), LTVs can be a leading indicator of a recession. Rising LTV ratios can foreshadow increasing financial stress – higher LTVs can mean people are underwater on their properties, making it harder for them to endure worsening economic conditions. However, rising LTVs can also indicate a hot housing market with many borrowers borrowing larger amounts to buy homes and through potentially riskier lending products. This can be an indicator that the housing market could be close to a period of correction or, in the worst case, a market crash like was experienced in 2008. Alternatively, LTVs can also be a lagging indicator of a recession. In the event of recession, while homeowners might not necessarily accumulate more debt, home values may start to decline as the market cools. As property values decrease, LTV ratios increase.
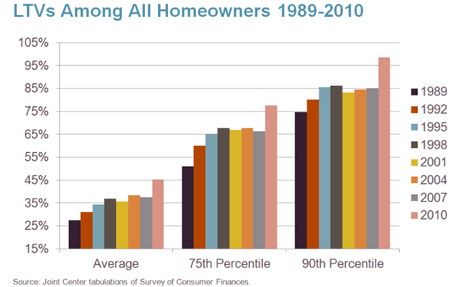
The following chart, from the Joint Center tabulations of Survey of Consumer Finances, displays how leading up to and during the great recession, LTVs increased steadily and ultimately peaked in 2010.
Unemployment Rates
Similar to FICO scores and LTVs, unemployment rates are also a lagging indicator of a recession. During the onset of a recession, businesses typically react by reducing production, cutting back on overtime, or adjusting working hours before resorting to workforce reductions. Consequently, the unemployment rate does not immediately reflect the initial stages of an economic contraction. As the recession deepens and businesses continue to face reduced demand, there may be layoffs or hiring freezes, which leads to an increase in the unemployment rate.
Yield Curve Inversions
A yield curve inversion is often considered one of the most reliable leading indicators of a recession. A yield curve inversion occurs when short-term interest rates become higher than long-term interest rates. Most commonly, economists will refer to the 2-year and 10-year bond rates (the “2-10 spread”) and the 2-year bond yielding more than the 10-year bond would be contrary to the typical expectation. This inversion is usually a sign that investors are more pessimistic about the long-term economy. As a direct result of this, investors buy long-term bonds as a safe haven for the anticipation of the weaker economic conditions ahead – more demand for the long-term bonds increases bond prices and pushes yields down. On the flip side, shorter-term rates may be higher as a result of the Federal Reserve’s ongoing policies such as tightening monetary policy in an effort to combat rising inflation.
The yield curve has inverted before every US recession dating back to the 1950s, though not every inversion has led to a recession. The following chart is from the Chicago Federal Reserve and details the 2-10 treasury spread from 1960 to 2020 with the blue line indicating the spread and the gray vertical lines indicating a recession as well as the recession’s duration. As shown, there was a negative spread in the late 1960s, but a recession didn’t occur until the early 1970s when the yield curve became more significantly inverted; however, every other inversion is correlated with a recession.
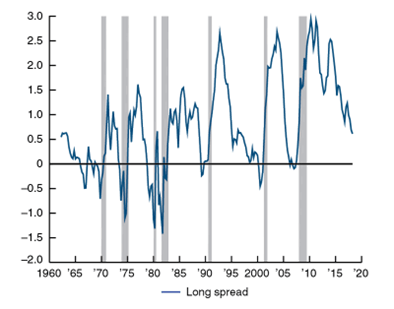
Despite the yield curve inverting again in mid-2022 (not shown above), the anticipated recession did not materialize. This was accredited to a combination of proactive policy measures taken by the Federal Reserve as well as rather favorable economic conditions which helped to avert a recession. Jerome Powell, current chair of the Federal Reserve, has referred to this as a “soft landing.”
Predictive Insights
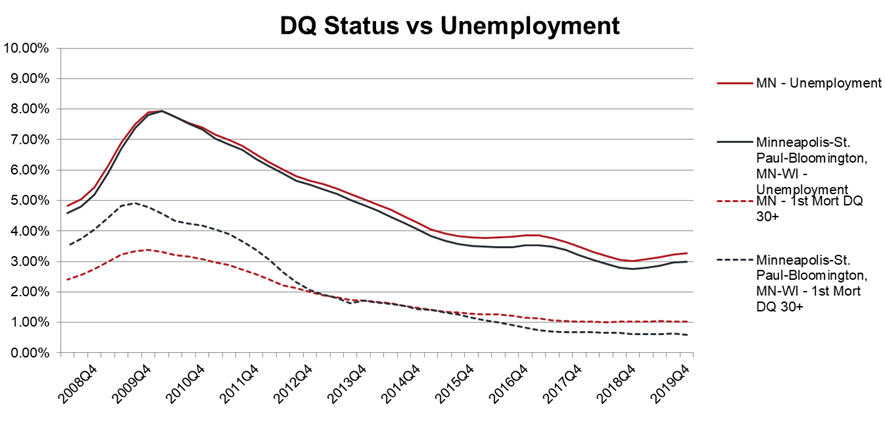
Through statistical studies, Wilary Winn has identified a strong relationship between unemployment rates, a lagging indicator as previously mentioned, and loan delinquency rates. Intuitively, when unemployment begins to rise, individuals with little or no access to income are increasingly likely to fall behind on their financial obligations. This includes both the inability to meet everyday expenses and, notably, to make timely payments on loans. As a result, loan delinquency rates—particularly for mortgages—tend to rise in parallel with growing unemployment levels. For example, the chart on the following page illustrates the relationship between the unemployment rates specific to Minnesota and the Minneapolis Metropolitan Statistical Area (MSA), and 30+ day mortgage delinquency rates across the same regions from 2007 Q4 through 2019 Q4, the last economic cycle.
As the data shows, when national unemployment began to rise sharply in late 2008 and ultimately peaked in late 2009, the delinquency rates for first mortgages also began to climb. However, there was a noticeable lag between the spike in unemployment and the rise in delinquencies. This delay is consistent with the time it takes for individuals to exhaust their financial resources, such as savings, or to experience the full impact of unemployment on their ability to meet existing debt obligations. For many, the immediate effect of losing a job is not a default on a mortgage but a temporary struggle, often followed by an inevitable decline in payment capacity as time goes on.
The lag between unemployment and delinquency rates can vary depending on numerous factors, including the nature of the debt, the severity of the economic downturn, and regional variations in unemployment. In this case, both Minnesota and the Minneapolis MSA experienced similar trends.
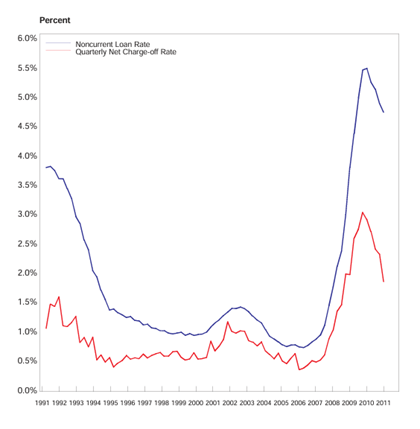
Higher delinquency rates are generally predictive of future increases in charge-offs, as lenders eventually write off loans that are unlikely to be repaid. Like delinquency’s relationship with unemployment, charge-offs typically occur with a delay after delinquency rates rise as lenders give ample time to borrowers to resolve any delinquencies. The following chart from the First Quarter 2011 FDIC Quarterly Banking Profile Report highlights the strong relationship between non-performing loans (60+ days delinquent) and the eventual net charge-offs for FDIC-insured institutions. It shows that as delinquency rates rise, charge-offs typically follow, albeit with a slight lag, underscoring the predictive link between delinquency and charge-offs.
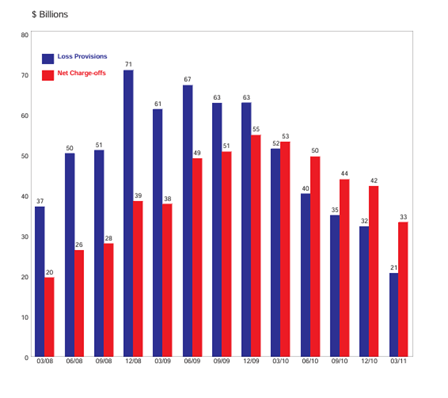
Before implementation of the CECL standard, financial institutions used net charge-off data primarily to estimate and adjust their allowance for loan and lease losses (ALLL). Charge-off data was analyzed alongside other factors like delinquency rates and economic conditions to provide a historical perspective on potential future loan losses. Institutions typically used historical charge-off trends to support reserve levels, adjusting for current credit quality, loan aging, and macroeconomic factors. While grounded in historical data, this ideology had limitations, particularly in accounting for potential future losses not yet realized at the time of calculation. This was in part due to the requirements of GAAP prior to CECL. The ALLL was to be provisioned only for probable losses. Despite this, institutions began provisioning for expected losses during the financial crisis before net charge-offs began to increase. The following chart, also from the First Quarter 2011 FDIC Quarterly Banking Profile Report, shows that loan provisions began to increase throughout 2008, peaking by year-end 2008, while net charge-offs didn’t peak until late 2009.
The data and analysis highlight a clear relationship between unemployment, loan delinquencies, and eventual charge-offs. As economic conditions deteriorate and unemployment rises, borrowers’ financial capacity gradually weakens—first reflected in growing delinquency rates, then in the rise of charge-offs as defaults materialize. Historical patterns, such as those seen during the last economic cycle, reinforce the predictive value of delinquency and charge-off trends. Although earlier accounting frameworks relied heavily on backward-looking metrics, financial institutions began responding to expected losses ahead of charge-off peaks, revealing a shift toward more anticipatory risk management practices even before CECL came into effect.
Recession Risk Management
Over the past month, the current administration has both proposed and enacted several tariff policies that are raising significant concerns among financial institutions. These institutions believe the tariffs may lead to a recession in the United States. Most notably, the International Monetary Fund (IMF) has lowered its forecast for U.S. growth from 2.7% to 1.8% and has increased its predicted probability of a recession from 25% in October 2024 to nearly 40% currently. Similarly, Goldman Sachs has raised its prediction by 15 percentage points to 35%. However, according to economists at JPMorgan, the likelihood of a U.S. recession is significantly higher than both the IMF’s and Goldman Sachs’s projections—closer to 60%.
In addition to reduced growth forecasts and a higher probability of recession, firms are also anticipating increased inflation as a result of the tariffs. Goldman Sachs expects core inflation (excluding food and energy) to reach 3.5% in 2025, a half-point increase from its previous forecast. Federal Reserve Chairman Jerome Powell echoed these concerns, stating that the impact of the tariffs on inflation is “significantly higher than expected” and “could be more persistent.”
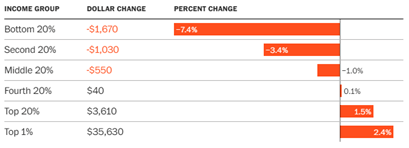
The combination of slower growth and higher inflation could create a challenging economic environment, with small businesses and consumers bearing the brunt of the impact. Furthermore, the consumers most affected by the tariffs are those with lower incomes. A study conducted by The Budget Lab at Yale, detailed below, shows that individuals in middle- and lower-income groups are likely to experience a net income decrease as a result of the hypothetical tax breaks funded by the tariffs.
Wilary Winn’s CECL Model Capabilities
As previously discussed, Wilary Winn’s CECL model is dynamic and can be adjusted to reflect evolving economic conditions. The base model incorporates baseline unemployment projections from S&P Connect (a subsidiary of S&P Global), but it also allows for the creation of stress scenarios to simulate adverse conditions—such as a recession driven by trade conflicts and proposed tariffs.
Leveraging the statistical analysis detailed earlier, Wilary Winn develops regressions to translate projected changes in unemployment—stemming from a mild recession—into anticipated increases in 30+ and 60+ day delinquencies. These delinquency projections are then converted into expected defaults using calculated roll rates, forming a future default vector that adjusts the loan’s default rate. The charts below illustrate baseline and stress-case unemployment projections for the Minneapolis MSA.
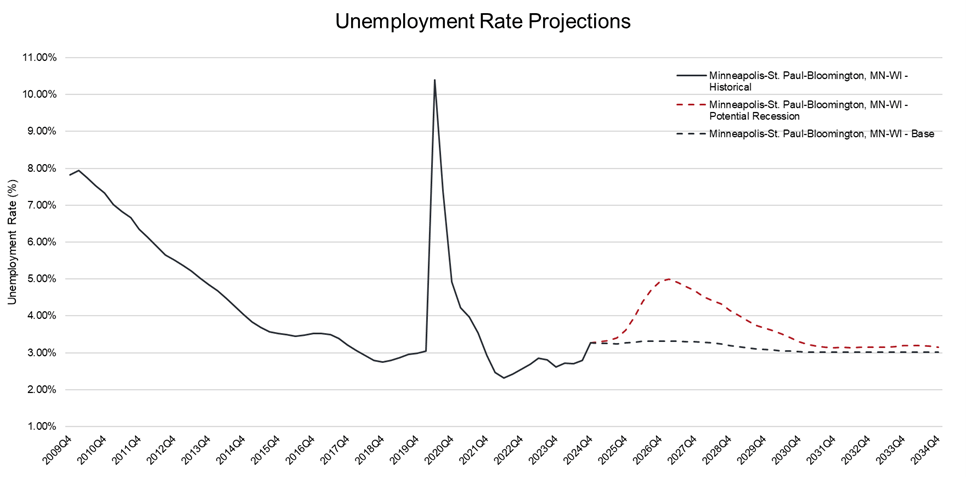

As unemployment rates shift, the model recalibrates the default rate using the roll rate analysis, allowing Wilary Winn to embed qualitative insights into a robust quantitative framework. The following chart displays the default multipliers applied under each scenario.

Beyond unemployment, the model also adjusts for potential changes in collateral values, particularly for real estate loans. Changes to the automated valuation model (AVM) affect the LTV ratio, which directly impacts severity — or loss given default — in the CECL model. Base projected appreciation or depreciation of property values, sourced from S&P Connect or customized stress scenarios, feed into this calculation. The following charts compare expected housing appreciation/depreciation in both the base and recession scenarios.
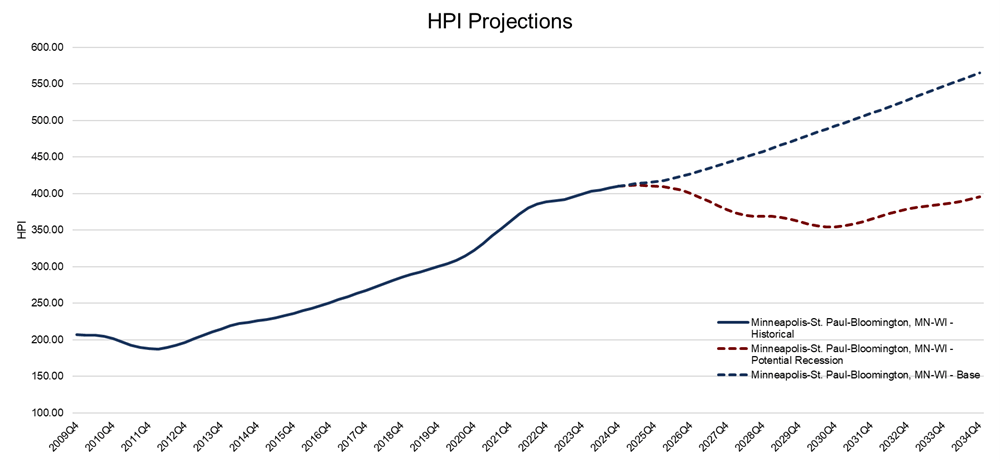

In summary, the base case anticipates steady appreciation, which would reduce severity and lower CECL loss estimates by improving LTVs. Conversely, the recession scenario assumes initial depreciation, increasing LTVs and thereby elevating severity and projected losses.
Final Thoughts
The complexities of predicting and preparing for a recession require both historical perspective and forward-looking analysis. As demonstrated throughout this white paper, leading and lagging indicators such as yield curve inversions, FICO score migration, LTV fluctuations, and unemployment rates all provide valuable insight into economic conditions and potential risks to credit quality. The 2008 financial crisis underscored the magnitude of these risks and the speed at which adverse economic conditions can deteriorate loan performance.
In the current economic environment, emerging threats such as rising tariffs and inflationary pressures have renewed concerns about the potential for a future downturn. As financial institutions seek to maintain resilient credit portfolios, tools that can dynamically incorporate economic forecasts and stress scenarios are increasingly essential.
Wilary Winn’s CECL model stands out in this regard, offering the flexibility to integrate quantitative indicators with qualitative overlays that reflect evolving economic realities. By capturing the interplay between unemployment and collateral values, the model enables institutions to proactively assess and manage credit risk.
Ultimately, institutions that can effectively leverage such models will be better positioned to navigate uncertainty, enhance risk mitigation strategies, and ensure long-term financial stability in the face of potential economic disruptions.