Credit Union Merger Results Through 2024 [White Paper]
Key Takeaway
We are the number one provider of credit union merger fair value determinations, providing us with deep insight and knowledge of the marketplace. Nationally recognized experts, we combine sophisticated financial expertise with a thorough understanding of the required accounting and have led trainings on the subject for the NCUA. Our white papers have been downloaded thousands of times.
How Can We Help You?
Founded in 2003, Wilary Winn LLC and its sister company, Wilary Winn Risk Management LLC, provide independent, objective, fee-based advice to over 600 financial institutions located across the country. We provide services for CECL, ALM, Mergers & Acquisitions, Valuation of Loan Servicing and more.
Released August 2025
Introduction
This white paper provides readers with an overall perspective of the credit union merger marketplace. The data includes industry-wide information on the number of mergers in the most recent decade as well as the size of the transactions.
You will also find valuation metrics from the work we have performed, including the changes in the fair values of the equity acquired, loans, share deposits and the core deposit intangibles. We show the number of transactions resulting in goodwill or a bargain purchase and conclude with our thoughts on forthcoming trends.
Merger Highlights Through 2024
In this paper, we recap credit union merger activity through the end of 2024, including recent merger trends and the growing number of credit unions purchasing banks. We also highlight how the current heightened interest rate environment affected merger valuation results. We conclude with our thoughts on where we believe the credit union merger landscape is headed over the next few years.
You will find industrywide information about the:
• Number of credit union mergers
• Size of the institutions merged-in
• Number of credit union purchases of banks
In addition, we provide insights from our own merger valuation work including the:
• Number of transactions which resulted in goodwill
• Trends in core deposit intangible values
• Average value of the financial assets and equity acquired, as well as liabilities assumed
If you are interested in more detail about a specific topic, please let us know.
Industry Merger Statistics
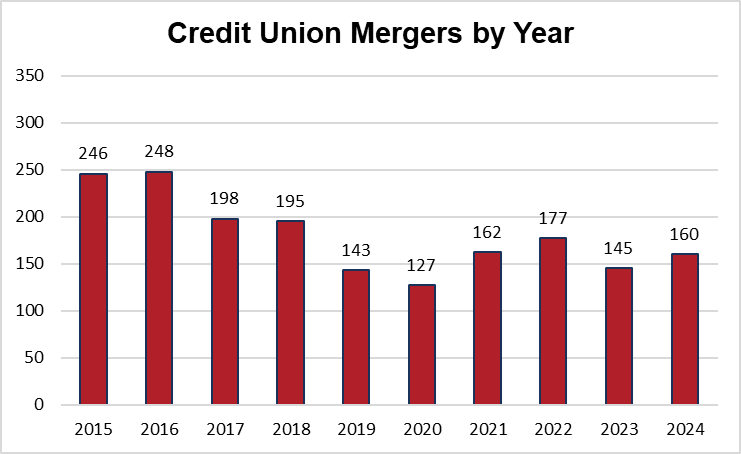
The following graph shows the number of credit union mergers approved by the NCUA each year since 2015. Consolidation in the credit union industry has slowed notably over the past six years. From 2015 to 2018, the industry averaged 222 mergers annually, while approvals declined to an average of 152 per year from 2019 through 2024. The trough in 2020 reflects the significant operational and financial challenges credit unions faced during the COVID-19 pandemic, as many institutions shifted focus from long-term strategic initiatives to immediate operational priorities. In subsequent years, merger volumes stabilized, albeit at lower levels than those seen in the early-to-mid 2010s.
The decline in credit union merger activity is partially attributable to prior industry consolidation, which has reduced the number of potential merger partners. In addition, recent mergers have become increasingly strategic, with credit unions seeking greater scale to enhance member benefit and remain competitive in a rapidly evolving marketplace.
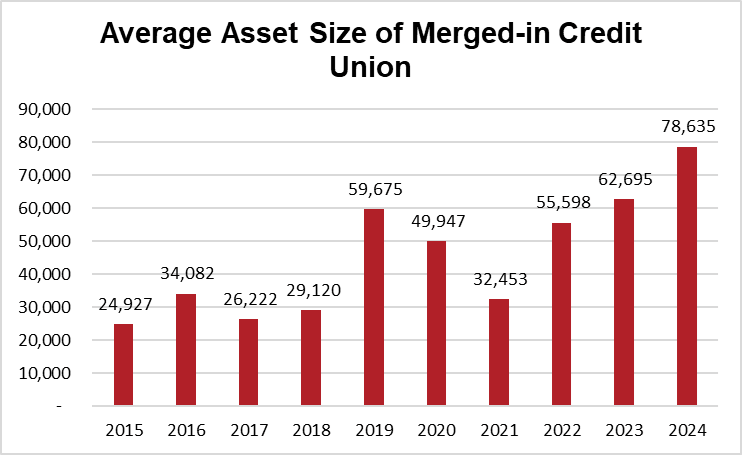
While the total number of mergers has declined since 2018, the average asset size of merged-in credit unions has increased significantly. In 2024, the average asset size of a merged-in credit union reached a record $78.6 million, surpassing the prior high of $62.7 million in 2023. These figures are notably higher than the average of $25.3 million observed from 2015 to 2018. This trend reflects the effects of prior consolidation, which has reduced the pool of smaller credit unions, as well as a shift toward more strategic mergers aimed at achieving scale.
Furthermore, we note that the number of mergers of equals over the past six years has contributed to an increase in the average asset size of the merged-in credit union. There have been ten mergers where the merging-in credit union has exceeded $1.0 billion in total assets since 2019, as compared to just two mergers in the ten preceding years. These include:
- Gesa Credit Union merger with Inspirus Credit Union in 2019
- SchoolsFirst Federal Credit Union merger with Schools Financial Credit Union in 2019
- TruStone Financial Federal Credit Union merger with Firefly Federal Credit Union 2020
- State Employees Federal Credit Union merger with Capital Communications Federal Credit Union in 2022
- New England Federal Credit Union merger with Vermont State Employees Credit Union in 2022
- Merrimack Valley Credit Union merger with RTN Federal Credit Union in 2023
- TwinStar Credit Union merger with Northwest Community Credit Union in 2023
- Spire Credit Union merger with Hiway Credit Union in 2023
- Virginia Credit Union merger with Member One Credit Union In 2024
- Rivermark Community Credit Union merger with Advantis Credit Union In 2024
Despite the increase in total assets acquired, most mergers since 2019 consisted of a credit union merging with an institution that had less than 10% of the acquirer’s total assets. Notably, only 7% of mergers were classified as a merger of equals over this same time period.

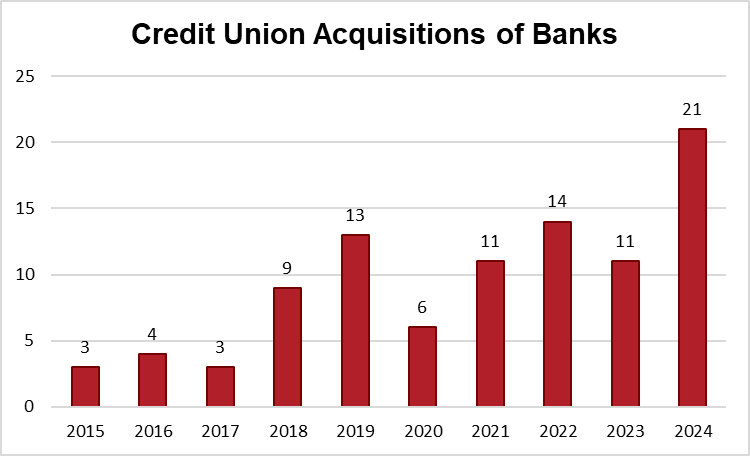
While the number of credit union mergers has remained lower since peaking in the 2010s, credit union acquisitions of banks have increased and reached record levels in recent years. Notably, the 21 announced deals in 2024 represented an all-time high, and there have already been six announced deals through July of 2025. Although the number of actual transactions involving credit unions acquiring banks is quite small relative to the number of mergers and acquisitions that take place each year, this trend has become a hot topic in the industry. Further detail surrounding the strategic, tax, and regulatory considerations concerning these types of transaction can be found in our white paper titled Credit Unions Purchasing Community Banks.
Wilary Winn Merger Financial Statistics
Wilary Winn serves nearly 300 credit unions, including 42 of the top 100. We have performed over 650 merger valuation engagements since 2009, ranging in transaction size from $2.0 million to as large as $3.0 billion in total assets. We note that all valuation work is performed on the acquired institution.
Purchase accounting requires that the merged-in institution’s balance sheet be recorded at fair value. To estimate the value of the acquired credit union, we begin by estimating the fair value of the equity acquired. We then estimate the fair value of the financial and non-financial assets and liabilities. Our third step is to estimate the value of the core deposit intangible. Next, we estimate the value of the trade name. Our final step is to estimate the amount of goodwill or bargain gain arising from the merger. The following charts reflect data compiled from valuation work we have performed since 2009.
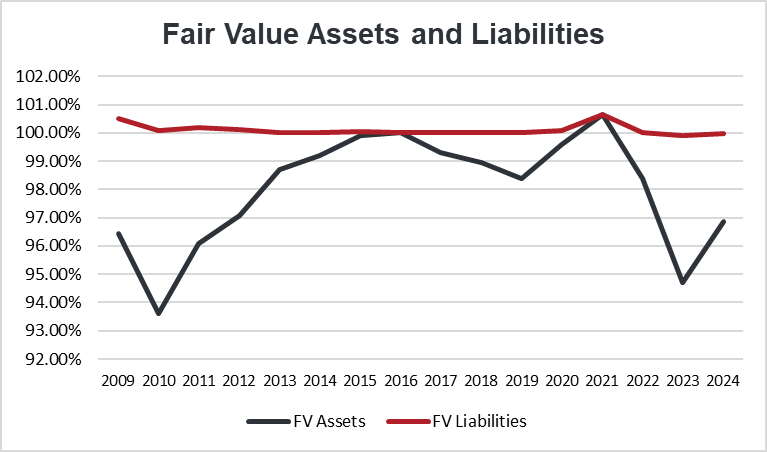
The fair value of assets and liabilities calculated in our valuation work is shown in the chart above. While the fair value of liabilities has remained relatively consistent throughout time, the fair value of assets has moved considerably since 2009. We attribute the volatility in the fair value of assets primarily to the shifts in the fair value of the investment and loan portfolio. The fair value estimates on our clients’ acquired loan portfolios improved markedly after 2010 resulting from lower expected credit losses, as the credit quality of the loan portfolios improved due to enhanced underwriting standards and healthier economic conditions coming out of the Great Recession. As a result, the fair value of acquired assets increased through 2016. Thereafter, we have seen a trend where changes in market rates have now been the driver of our asset fair value marks. This trend has been especially relevant over the past five years, where the fair value of assets rose considerably in 2020 to 2021 due to the significant reduction of market interest rates resulting from the Federal Reserve’s zero interest rate policy during the COVID-19 pandemic. However, the fair value of assets decreased substantially in 2022 and 2023 during the Federal Reserve’s rate hiking cycle. Specifically, rising market interest rates during this period resulted in large devaluations of the acquired investment and loan portfolios, as many of these assets were longer-term, earned fixed rates, and had been brought onto balance sheets during the low-rate environment that was present in previous years.
Overall, the fair value of acquired assets rebounded in 2024 as investment and loan portfolios began to reprice upward in the heightened interest rate environment. Additionally, the softening of market interest rates resulting from the Federal Reserve’s rate cuts during the year also helped to raise the fair value of acquired assets.
Loans
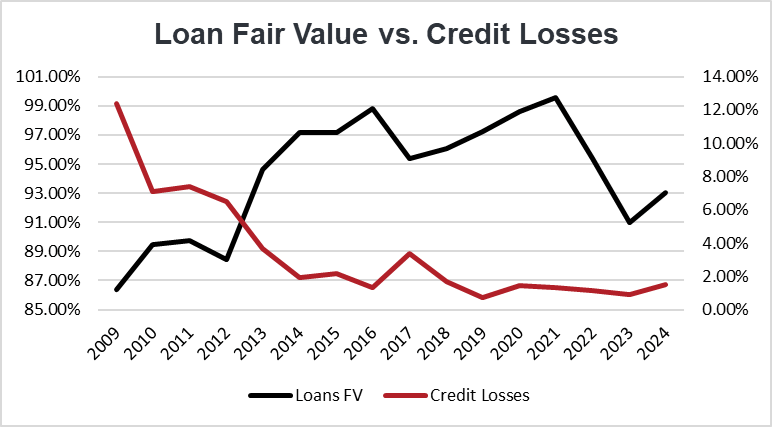
Wilary Winn’s loan valuations include both a mark-to-market discount rate difference and a lifetime credit loss estimate. As shown in the graph below, there was an inverse relationship between our lifetime credit loss mark and the overall fair value of the loan portfolio through 2019. Beginning in 2020, the mark-to-market discount rate difference became the primary driver of fair value changes in
acquired loan portfolios instead of expected credit losses. As previously mentioned, fair value marks peaked in 2021, reflecting the low-interest-rate environment at that time. Since then, acquired loans have been marked at larger discounts, as rising interest rates have significantly reduced the value of these assets. Notably, lifetime credit loss estimates trended lower from 2020 through 2023, driven in part by the federal government’s massive COVID-19 stimulus programs, which contributed to historically low levels of delinquencies and net charge-offs.
Overall, the fair value of acquired loan portfolios improved in 2024 as the heightened rate environment of recent years continued to support repricing of loan portfolios. Additionally, the Federal Reserve’s easing of monetary policy in 2024, including multiple rate cuts, led to a softening of market rates. This combination of upward repricing and a more favorable rate environment contributed to a rebound in the fair value of acquired loan portfolios during the year. At the same time, lifetime credit loss estimates increased in 2024 as credit performance normalized back to pre-pandemic levels.
Share Accounts and Core Deposit Intangibles
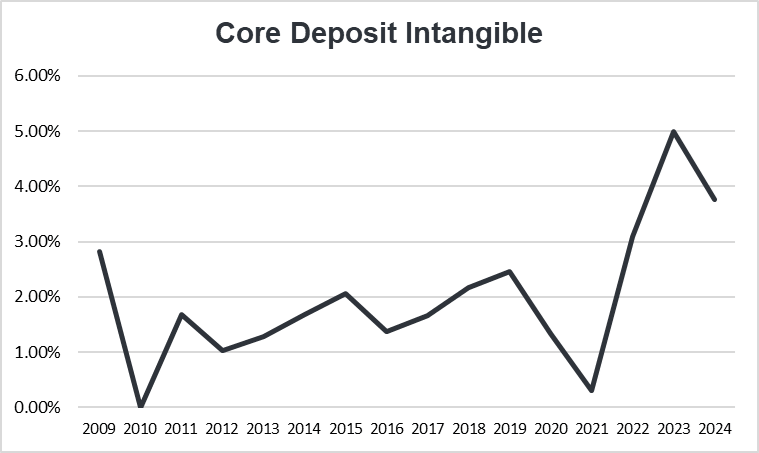
The premise underlying the core deposit intangible is that a rational buyer is willing to pay a premium to obtain a group of core deposit accounts that are less expensive than the buyer’s marginal cost of funds. Wilary Winn’s calculations of the core deposit intangible from 2009 through 2024 are shown in the following chart. During the post-recession period, core deposit intangibles generally ranged from 1.00%-3.00% of total core deposits. However, core deposit intangibles reached near-zero levels in 2020 and 2021, as significant decreases in borrowings costs (i.e., the marginal cost of funds) resulted in the spread between the cost to borrow and the cost to maintain the deposits shrinking considerably. Thereafter, core deposit intangibles increased rapidly in 2022 to 2023 due to increases in alternative funding costs, while the rates paid on deposits at most institutions increased at a much slower pace. Notably, this wide spread between the cost to maintain the core deposits and the cost to borrow persisted in 2024, helping to sustain core deposit intangible values at elevated levels.
Wilary Winn notes that the core deposit intangible is typically the most expensive accounting cost related to a merger, as this intangible asset must be amortized over time as a decrease in non-interest income.
Equity
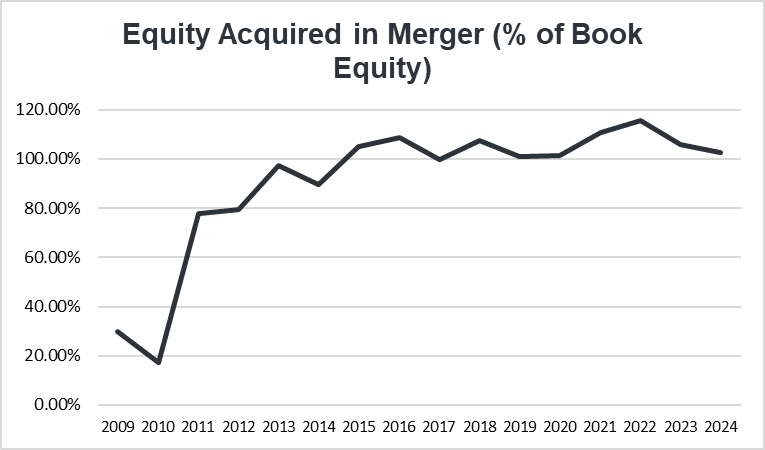
The chart below shows the fair value of the equity acquired in mergers as a percentage of book equity for all merger valuations performed by Wilary Winn since 2009. Wilary Winn employs three valuation methods to estimate the overall value of the entity: discounted cash flow, guideline transaction, and guideline public company. The discounted cash flow method is considered an income approach, whereas the guideline transaction and guideline public company methods are considered market approaches. As shown in the chart, the fair value of equity acquired in mergers rose sharply following the Great Recession and has generally remained near or above par since 2015. Wilary Winn notes that premiums paid for credit unions tend to be lower than bank premiums seen in the marketplace. We attribute this to bank shareholders’ direct access to earnings in the form of share prices and direct dividends, whereas credit unions typically pay out earnings to members in the form of increased services, lower loan rates, and higher deposit rates over time.
In 2023 and 2024, the fair value of equity acquired in mergers decreased from the highs of the preceding years. This trend was driven largely by the compression of the market multiples applied in the guideline transaction and guideline public company methods. Specifically, price-tangible book value multiples contracted in response to liquidity pressures faced by many financial institutions, elevated funding costs leading to lower net interest margins, and a more uncertain economic environment. These factors, along with broader market volatility and a heightened rate environment, contributed to the reduced fair value of equity acquired in mergers.
Goodwill and Bargain Purchases
Under the purchase accounting rules, the value of goodwill is the “plug” or the difference between the fair value of equity and the fair values of the net assets recorded on the acquisition date. The accounting rules presume that goodwill will be recorded on “day one.” The rules contemplate the recording of a bargain purchase when the fair value of the net assets exceeds the fair value of equity recorded. However, bargain purchases are intended to be relatively rare events. In fact, the rules require that an acquirer “double check” its work before recording a bargain purchase.
Only 12% of our valuations resulted in a bargain purchase gain, which we generally see only when the institution being merged-in is distressed or in NCUA-assisted transactions.
Merger Industry – Looking Forward
While future merger activity remains uncertain, we continue to see a relatively strong level of mergers year-over-year. We believe the following trends will drive the credit union merger marketplace over the next few years.
- Despite markets anticipating future rate cuts in 2025, we expect that credit unions’ funding costs will remain elevated as competition for core deposits remains high. In addition, a decline in reinvestment rates for earning assets will further pressure these institutions’ net interest margins. As a result, we anticipate smaller institutions will continue to struggle to maintain profitability and will ultimately seek merger partners due to the pressure on institutions’ net interest margins and the higher percentage of fixed regulatory costs to total costs when operating a small financial institution.
- Credit quality continued to normalize over the last year following a period of historically strong loan performance due to the governmental assistance provided to borrowers in response to the pandemic. However, delinquencies and net charge-offs remain on the rise, weighing on credit unions’ earnings. While capital levels remain relatively strong across the industry, we believe many smaller institutions will seek to be merged-in before their capital erodes to unacceptable levels.
- In recent years, artificial intelligence and other technological advances have expedited the shift of many institutions’ members to digital banking and highlighted the need for strong technological solutions. However, credit unions often lack the resources to adequately meet the technological demands of their members. As a result, many institutions will seek merger partners with superior technology or combine to have the resources required to offer the electronic banking demanded in the marketplace.
- We expect to continue to see an increase in the number of mergers of equals. Credit unions of moderate size view the opportunity to merge as a means to quickly achieve economies of scale to better compete in the ever-evolving financial institution industry.
- We expect credit union purchases of banks to continue in 2025, following a record year for this type of deal activity in 2024. Ultimately, credit unions will continue looking for strategic ways to scale and grow membership bases.