Insights From the SBA 7(a) Loan Program [White Paper]
Table of Contents
Skip to table of contents- Introduction
- SBA 7(a) Program Summary
- Examination of Long-Term Performance
- Economic Environment and Loan Performance
- Sector-Specific Performance Analysis
- Best Performing Sectors
- Common Characteristics Among Best Performing Sectors
- Worst Performing Industries
- Common Characteristics Among Best Performing Sectors
- Conclusion
- References
Key Takeaway
Wilary Winn is an expert in the SBA 7(a) secondary market and provides valuations of SBA 7(a) loan servicing rights as well as turnkey advice on how to properly account for them.
How Can We Help You?
Founded in 2003, Wilary Winn LLC and its sister company, Wilary Winn Risk Management LLC, provide independent, objective, fee-based advice to over 600 financial institutions located across the country. We provide services for CECL, ALM, Mergers & Acquisitions, Valuation of Loan Servicing and more.
Released April 2024
Introduction
The primary purpose of this white paper is to examine the historical trends and uncover performance insights from the SBA 7(a) loan program.
By analyzing long-term performance metrics, industry-specific analyses, and the relationship between economic environments and loan performance, we aim to provide a comprehensive understanding that informs decision-making and enhances risk management for community financial institutions.
SBA 7(a) Program Summary
According to the U.S. Small Business Administration (SBA), the SBA 7(a) loan program is the “SBA’s most common loan program, which includes financial help for businesses with special requirements.” In fiscal year 2023, the 7(a) loan program approved 57,362 federal loan guarantees on approximately $27.5 billion of privately originated small business loans through 1,449 lenders. The average approved 7(a) loan amount was $479,685. As described in our “SBA 7(a) Loans and Secondary Market Accounting Implications” white paper, the 7(a) loan is commonly used when real estate is involved in the purchase. However, it is also used for working capital requirements, equipment, inventory purchases, and to refinance existing debt. The loan guaranty program is intended to incentivize financial institutions to provide lending to small businesses that might not otherwise be able to obtain financing. These small businesses generally have adequate repayment capacity based on reasonable cash flow projections but may have weak collateral or a lack of established credit or cash flow history. The primary risks associated with SBA lending are credit, operational, compliance, liquidity, price, and strategic, with many of these risks interrelated. The lender and the SBA share risk in the transactions, and both have a mutual interest in good underwriting and strong loan performance.
This analysis is grounded in a comprehensive dataset obtained from the Small Business Administration (SBA), made accessible through the Freedom of Information Act (FOIA). The dataset (as of December 31, 2023) contains a total of 1,786,705 individual SBA 7(a) loans, amounting to a substantial $517,506,088,939 in gross approvals. This extensive collection of data represents a significant portion of the financial assistance provided to small businesses across the United States through the SBA 7(a) loan program. The scale and detail of the dataset offers a unique opportunity to conduct an in-depth analysis of the program’s impact, performance trends, and the economic factors influencing its outcomes.
Examination of Long-Term Performance
Assessing the long-term performance of the SBA 7(a) loan program as a whole is imperative for facilitating an understanding of how the program adapts to varying economic conditions, identifying patterns of charge-offs, and ultimately providing insights that are crucial for informed decision-making, proactive risk management, and the continual enhancement of lending strategies within the landscape of small business financing.
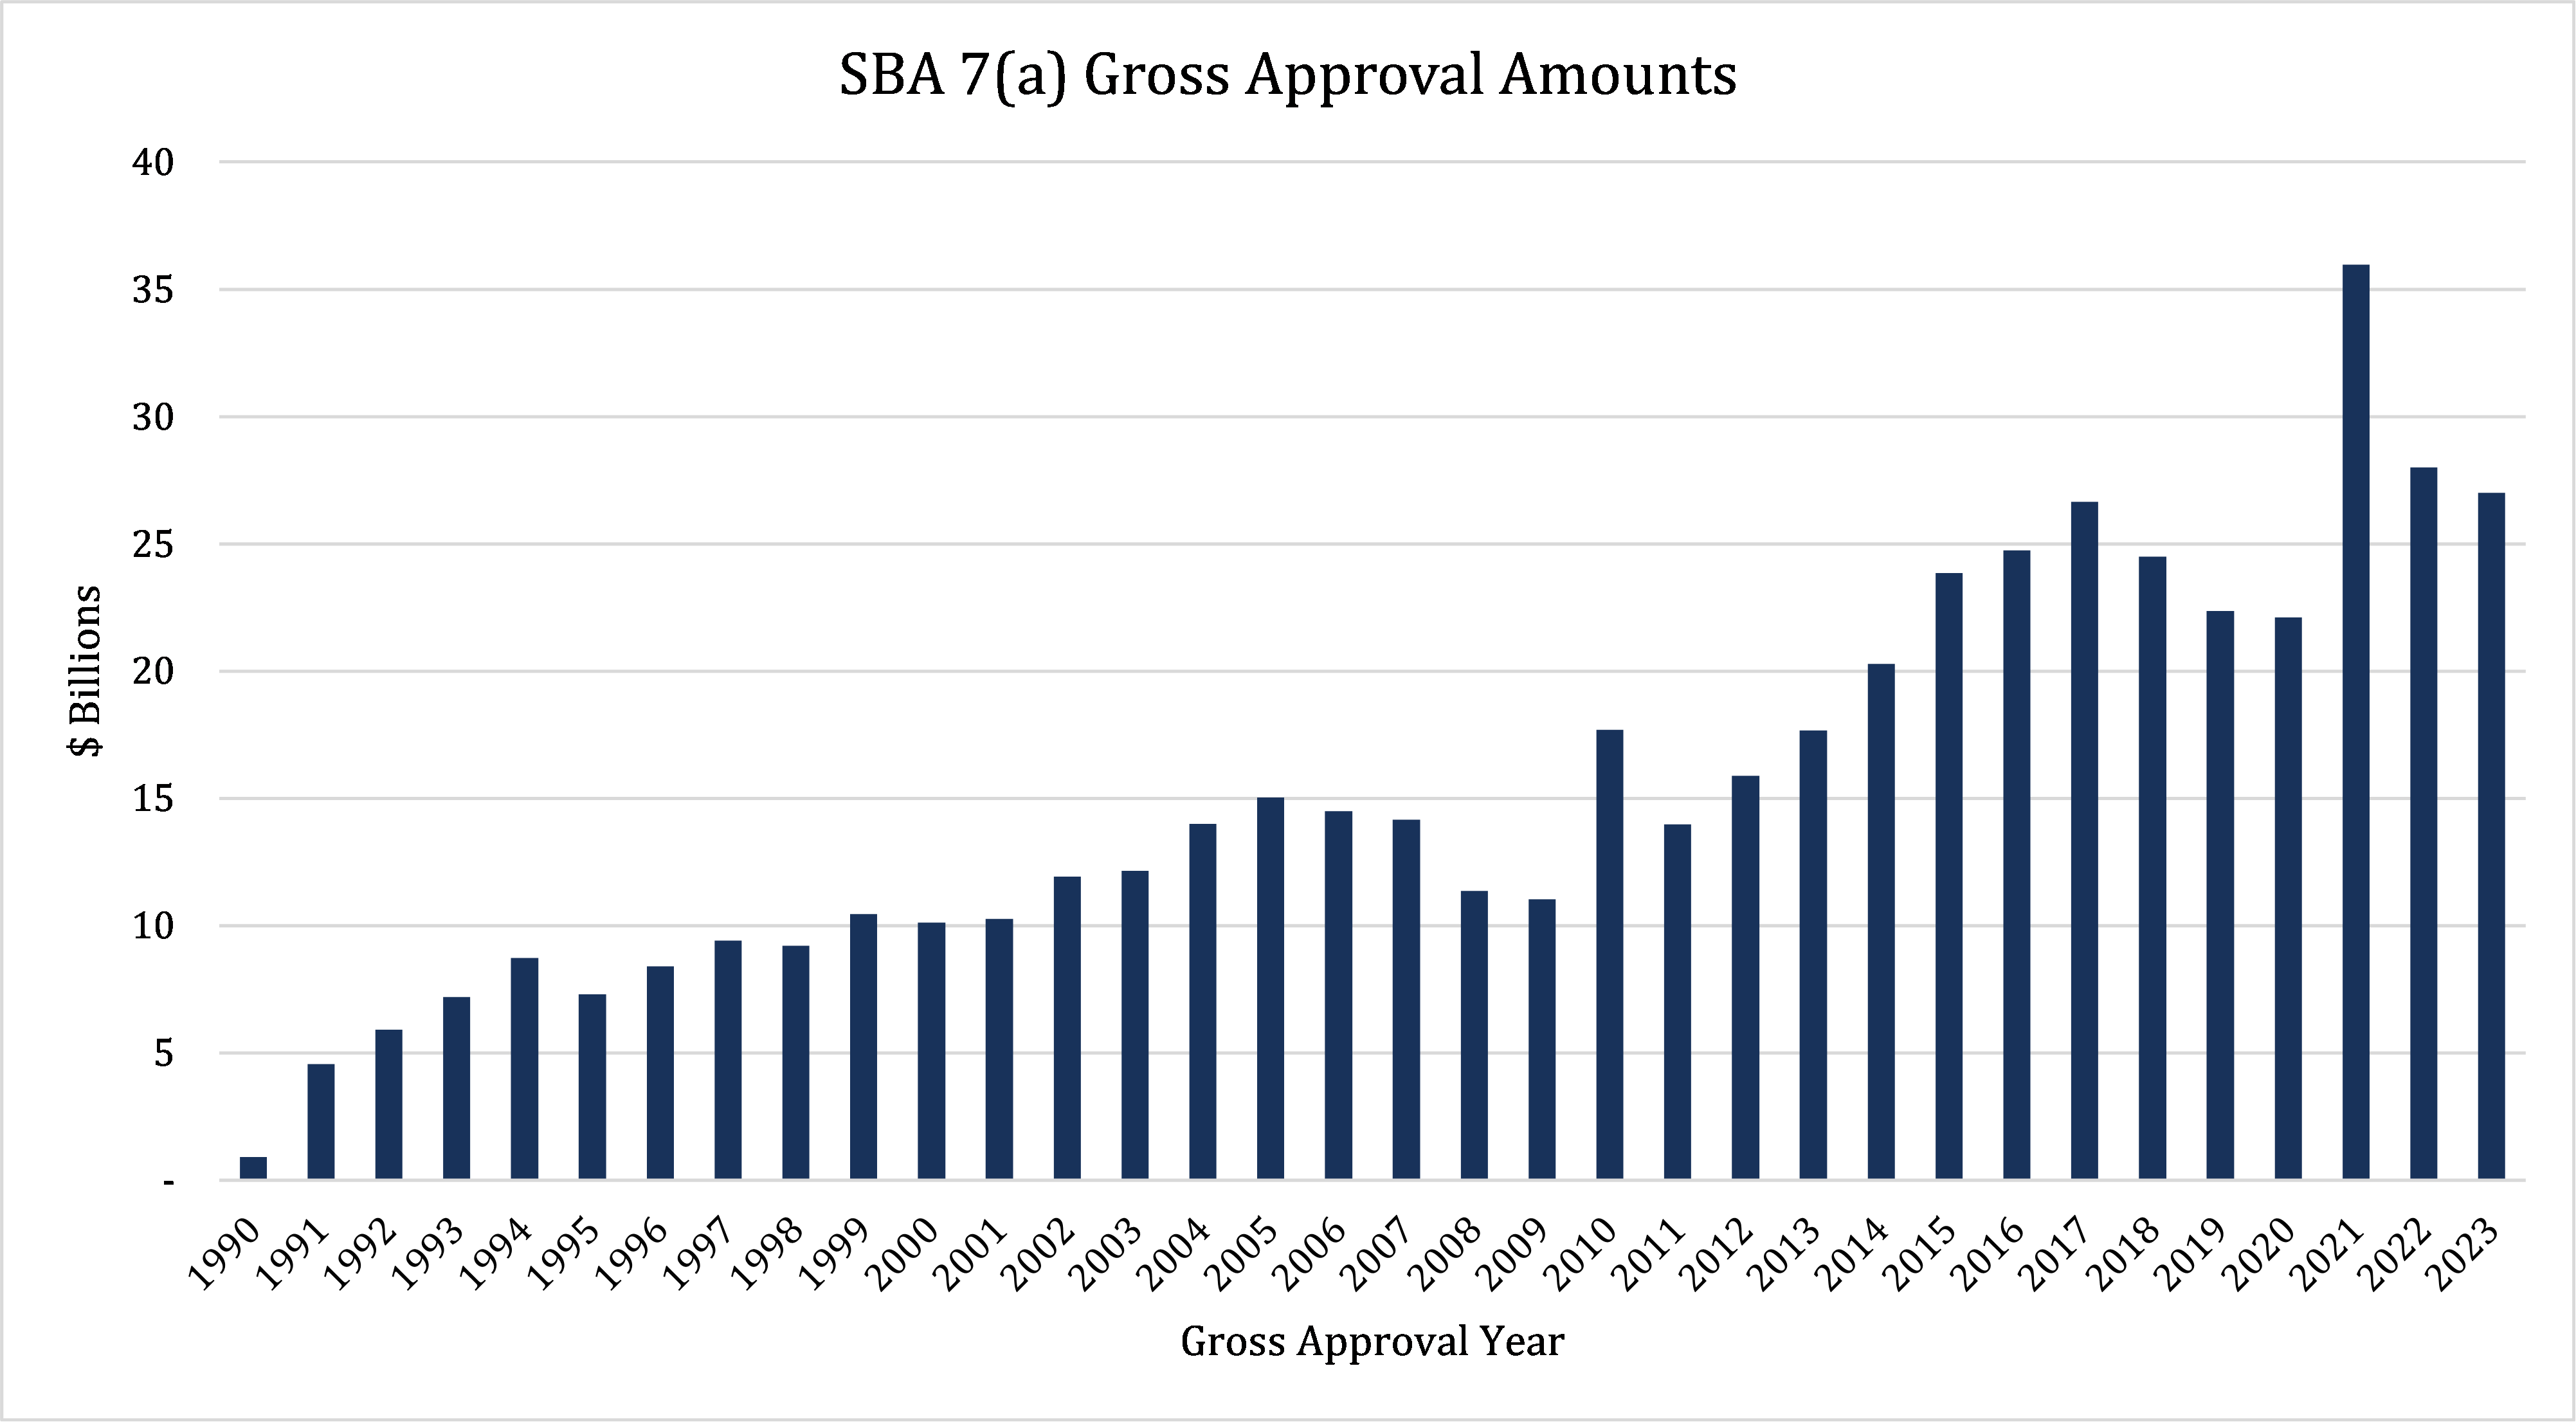
The following graph shows the SBA 7(a) gross approval amounts by year, from 1990 through year-end 2023. The popularity of the SBA 7(a) program over the last three decades is influenced by the broader economic landscape, generally increasing during economic expansions, and decreasing as economic conditions weaken.
Charge-offs are a fundamental metric used in assessing the performance and risk associated with loan portfolios. Charge-offs represent the accounting practice of declaring a loan as uncollectible and removing it from the lender’s balance sheet as a loss. It reflects the lender’s acknowledgment that the loan is unlikely to be repaid, either partially or in full, and results in actual financial losses for the institution. High charge-off rates can significantly impact a lender’s profitability and capital, necessitating strict risk management measures to mitigate losses.
The following graph shows the SBA 7(a) gross charge-off amounts by year, from 1990 through year-end 2023. Initially, charge-offs were minimal, experiencing a gradual increase to $0.34 billion in 1999. This upward trend reflects both the growth of the program and the inevitable distress that some borrowers experience over time. The early 2000s displayed significant fluctuations in charge-off amounts, peaking dramatically in 2010 at $2.04 billion. This spike is tied to the financial crisis of 2008 and the subsequent recession, which severely impacted small businesses and led to increased loan defaults. After the surge in 2010, charge-offs decreased to a relative low of $0.68 billion in 2013 before spiking again to $2.06 billion in 2015, reflecting lagged effects of economic challenges across various sectors.
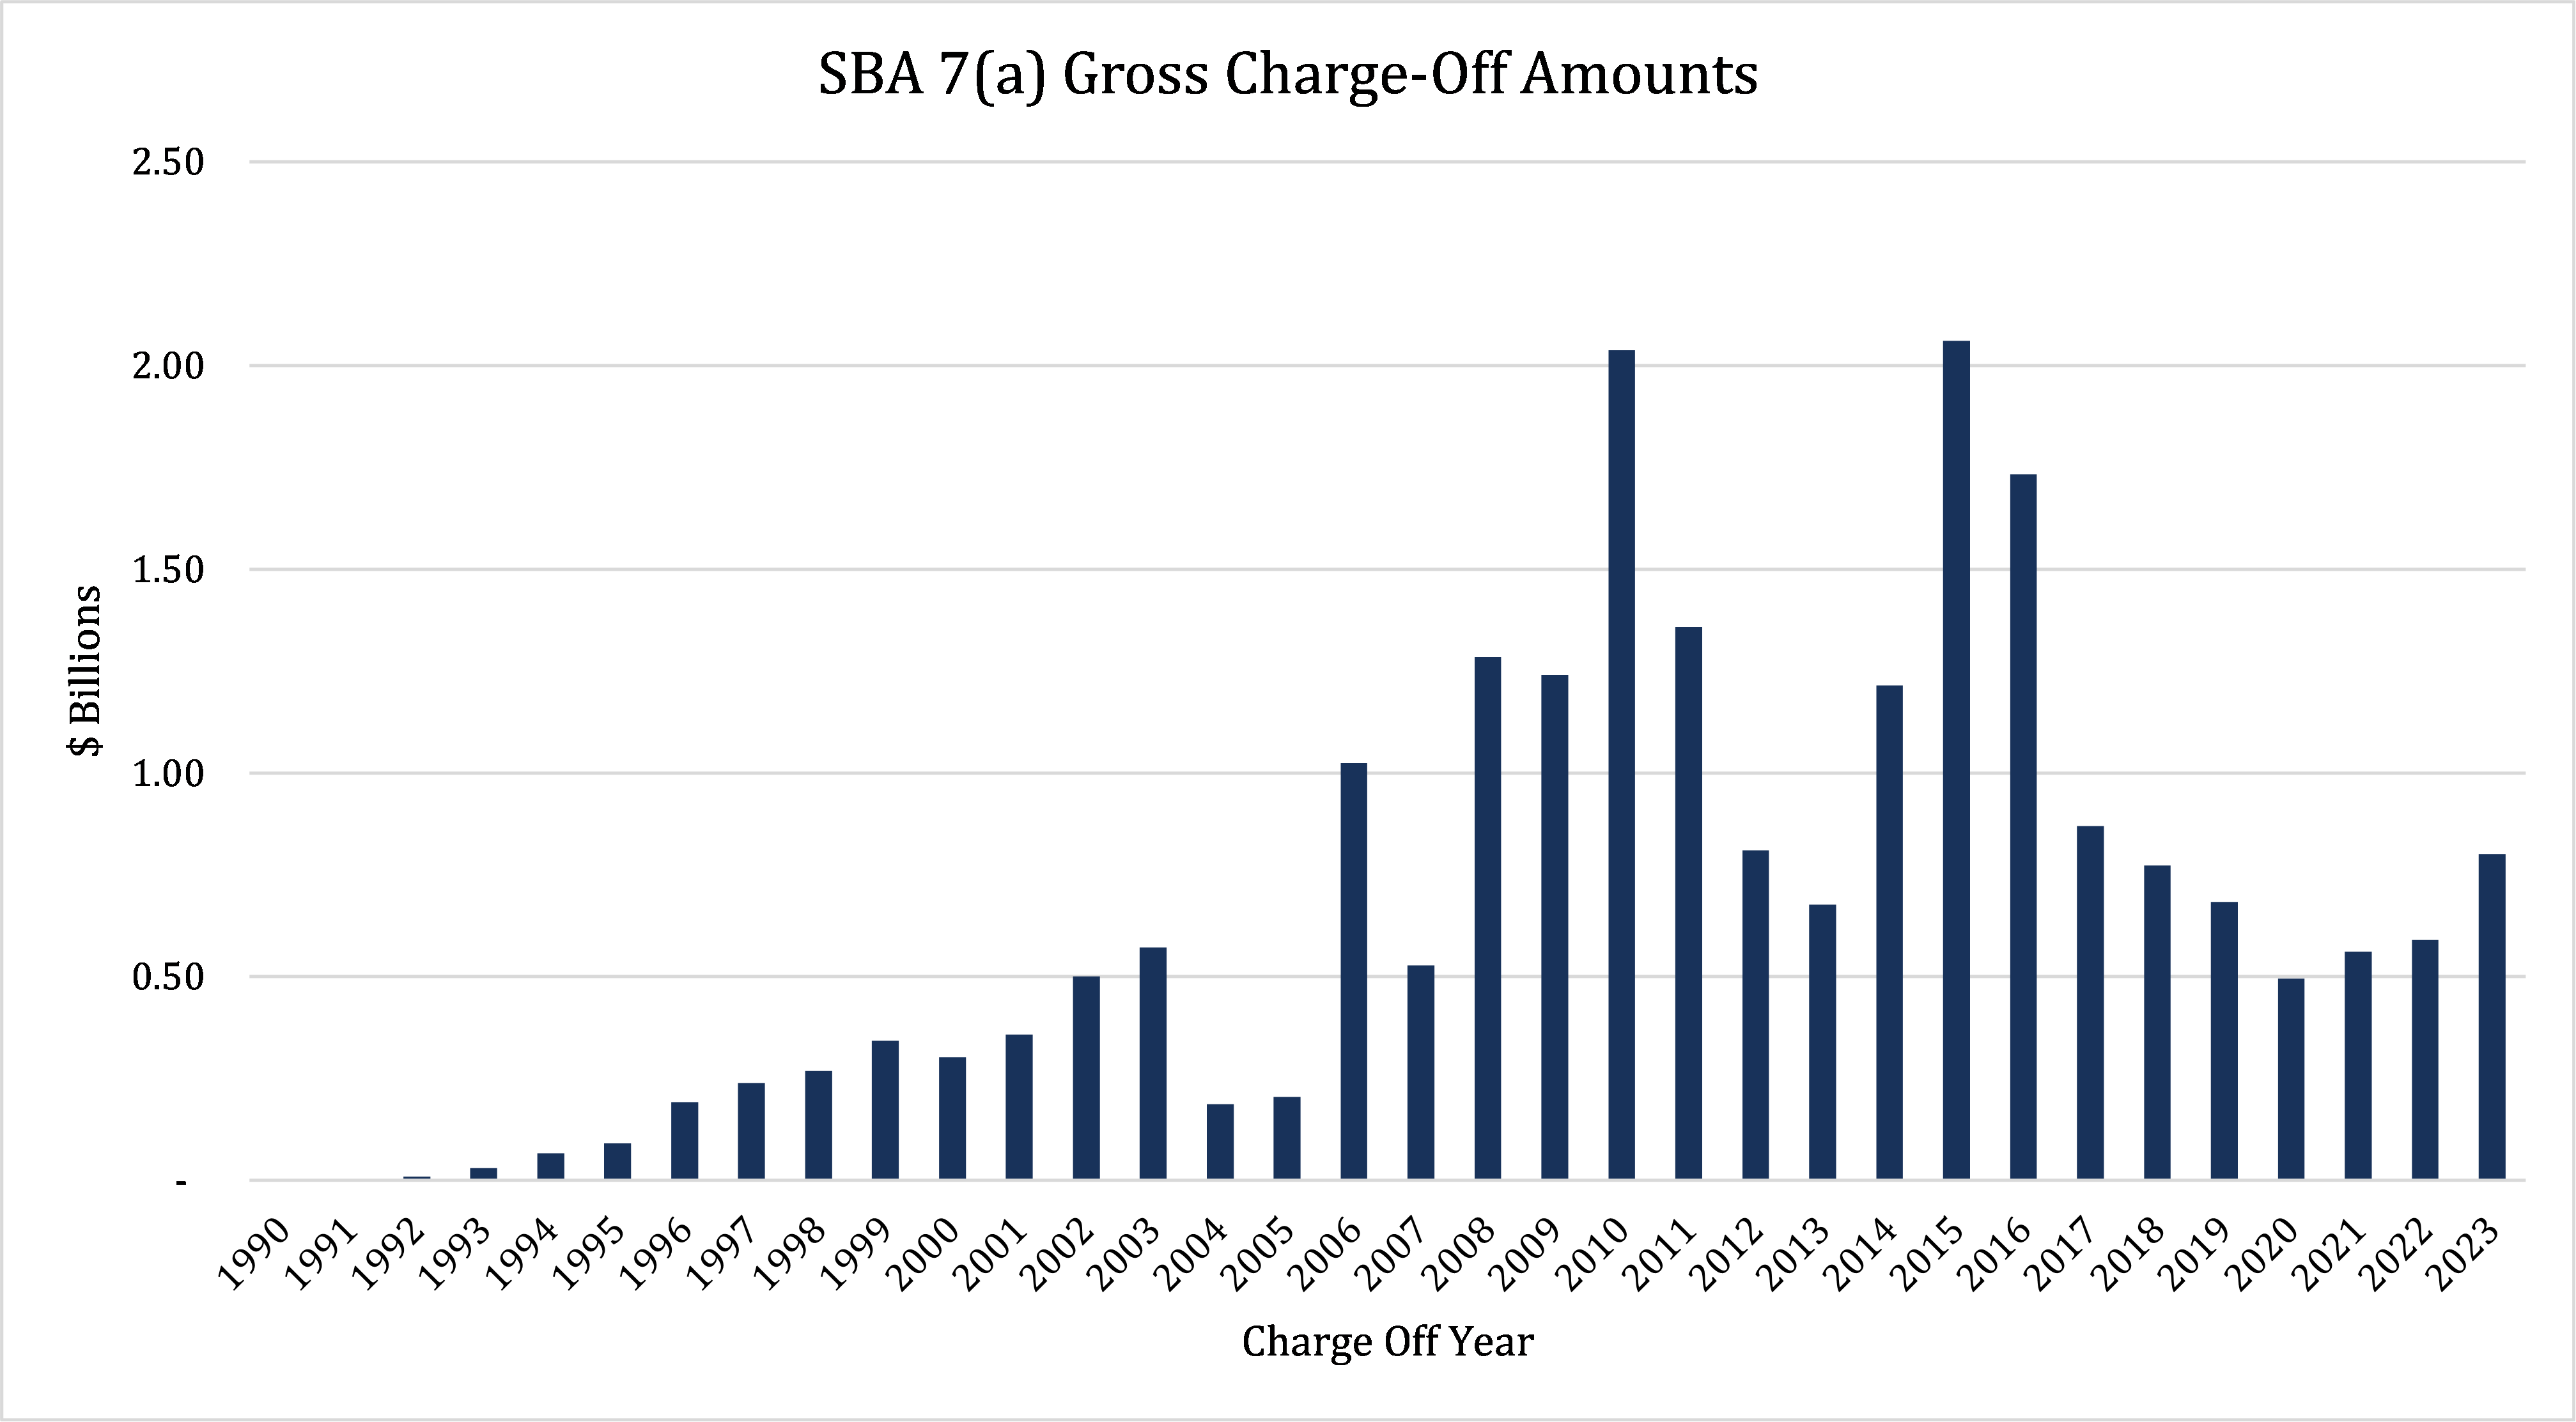
Charge-offs have decreased significantly since 2015 and remained relatively stable during the COVID-19 pandemic. Although exhibiting an increasing trend from $0.49 billion in 2020 to $0.80 billion in 2023, recent levels of charge-offs suggest a stabilization in the aftermath of the pandemic’s economic impacts, with recent increases attributable to broader economic stress.
Economic Environment and Loan Performance
The economic environment is a key driver of loan performance. In a healthy economy, businesses typically see increased revenue and rarely encounter issues with their ability to repay loans. Conversely, in economic downturns, loan defaults tend to increase as economic hardship leads to financial stress. Assessing the impact of the economic environment on loan performance is a crucial factor in developing risk models and underwriting criteria.
Though the available data spans multiple business cycles, we have focused our analysis on the 2008 recessionary period and ensuing recovery. This represents a global financial crisis that resulted in a sharp contraction in the economy, and lead to a significant increase in loan defaults. As credit markets tightened, businesses faced unprecedented challenges, including liquidity shortages and decreasing demand.
During this period, loan performance deteriorated as businesses struggled to navigate the adverse economic environment. The SBA 7(a) program, despite its purpose of supporting small businesses, was not immune to the wider slowdown in credit. All sectors experienced increased scrutiny of loan applications, with many lenders tightening their credit standards in response to the heightened risk environment.
However, the impact on loan performance was not immediate. There’s often a lag between economic downturns and the realization of credit losses. Initially, borrowers may turn to existing liquidity or find alternative financing sources to keep up with loan obligations. As the recession progressed, charge-offs continued to rise to a relative peak of $560 million in the second quarter of 2010. Subsequent to 2010, charge-offs decreased rapidly to $127 million in the second quarter of 2013 before surging again to $844 million in the third quarter of 2015. The quick recovery and subsequent rapid re-deterioration in charge-offs reflects the prolonged distress borrowers faced as the effects of the recession continued to reverberate throughout various sectors.
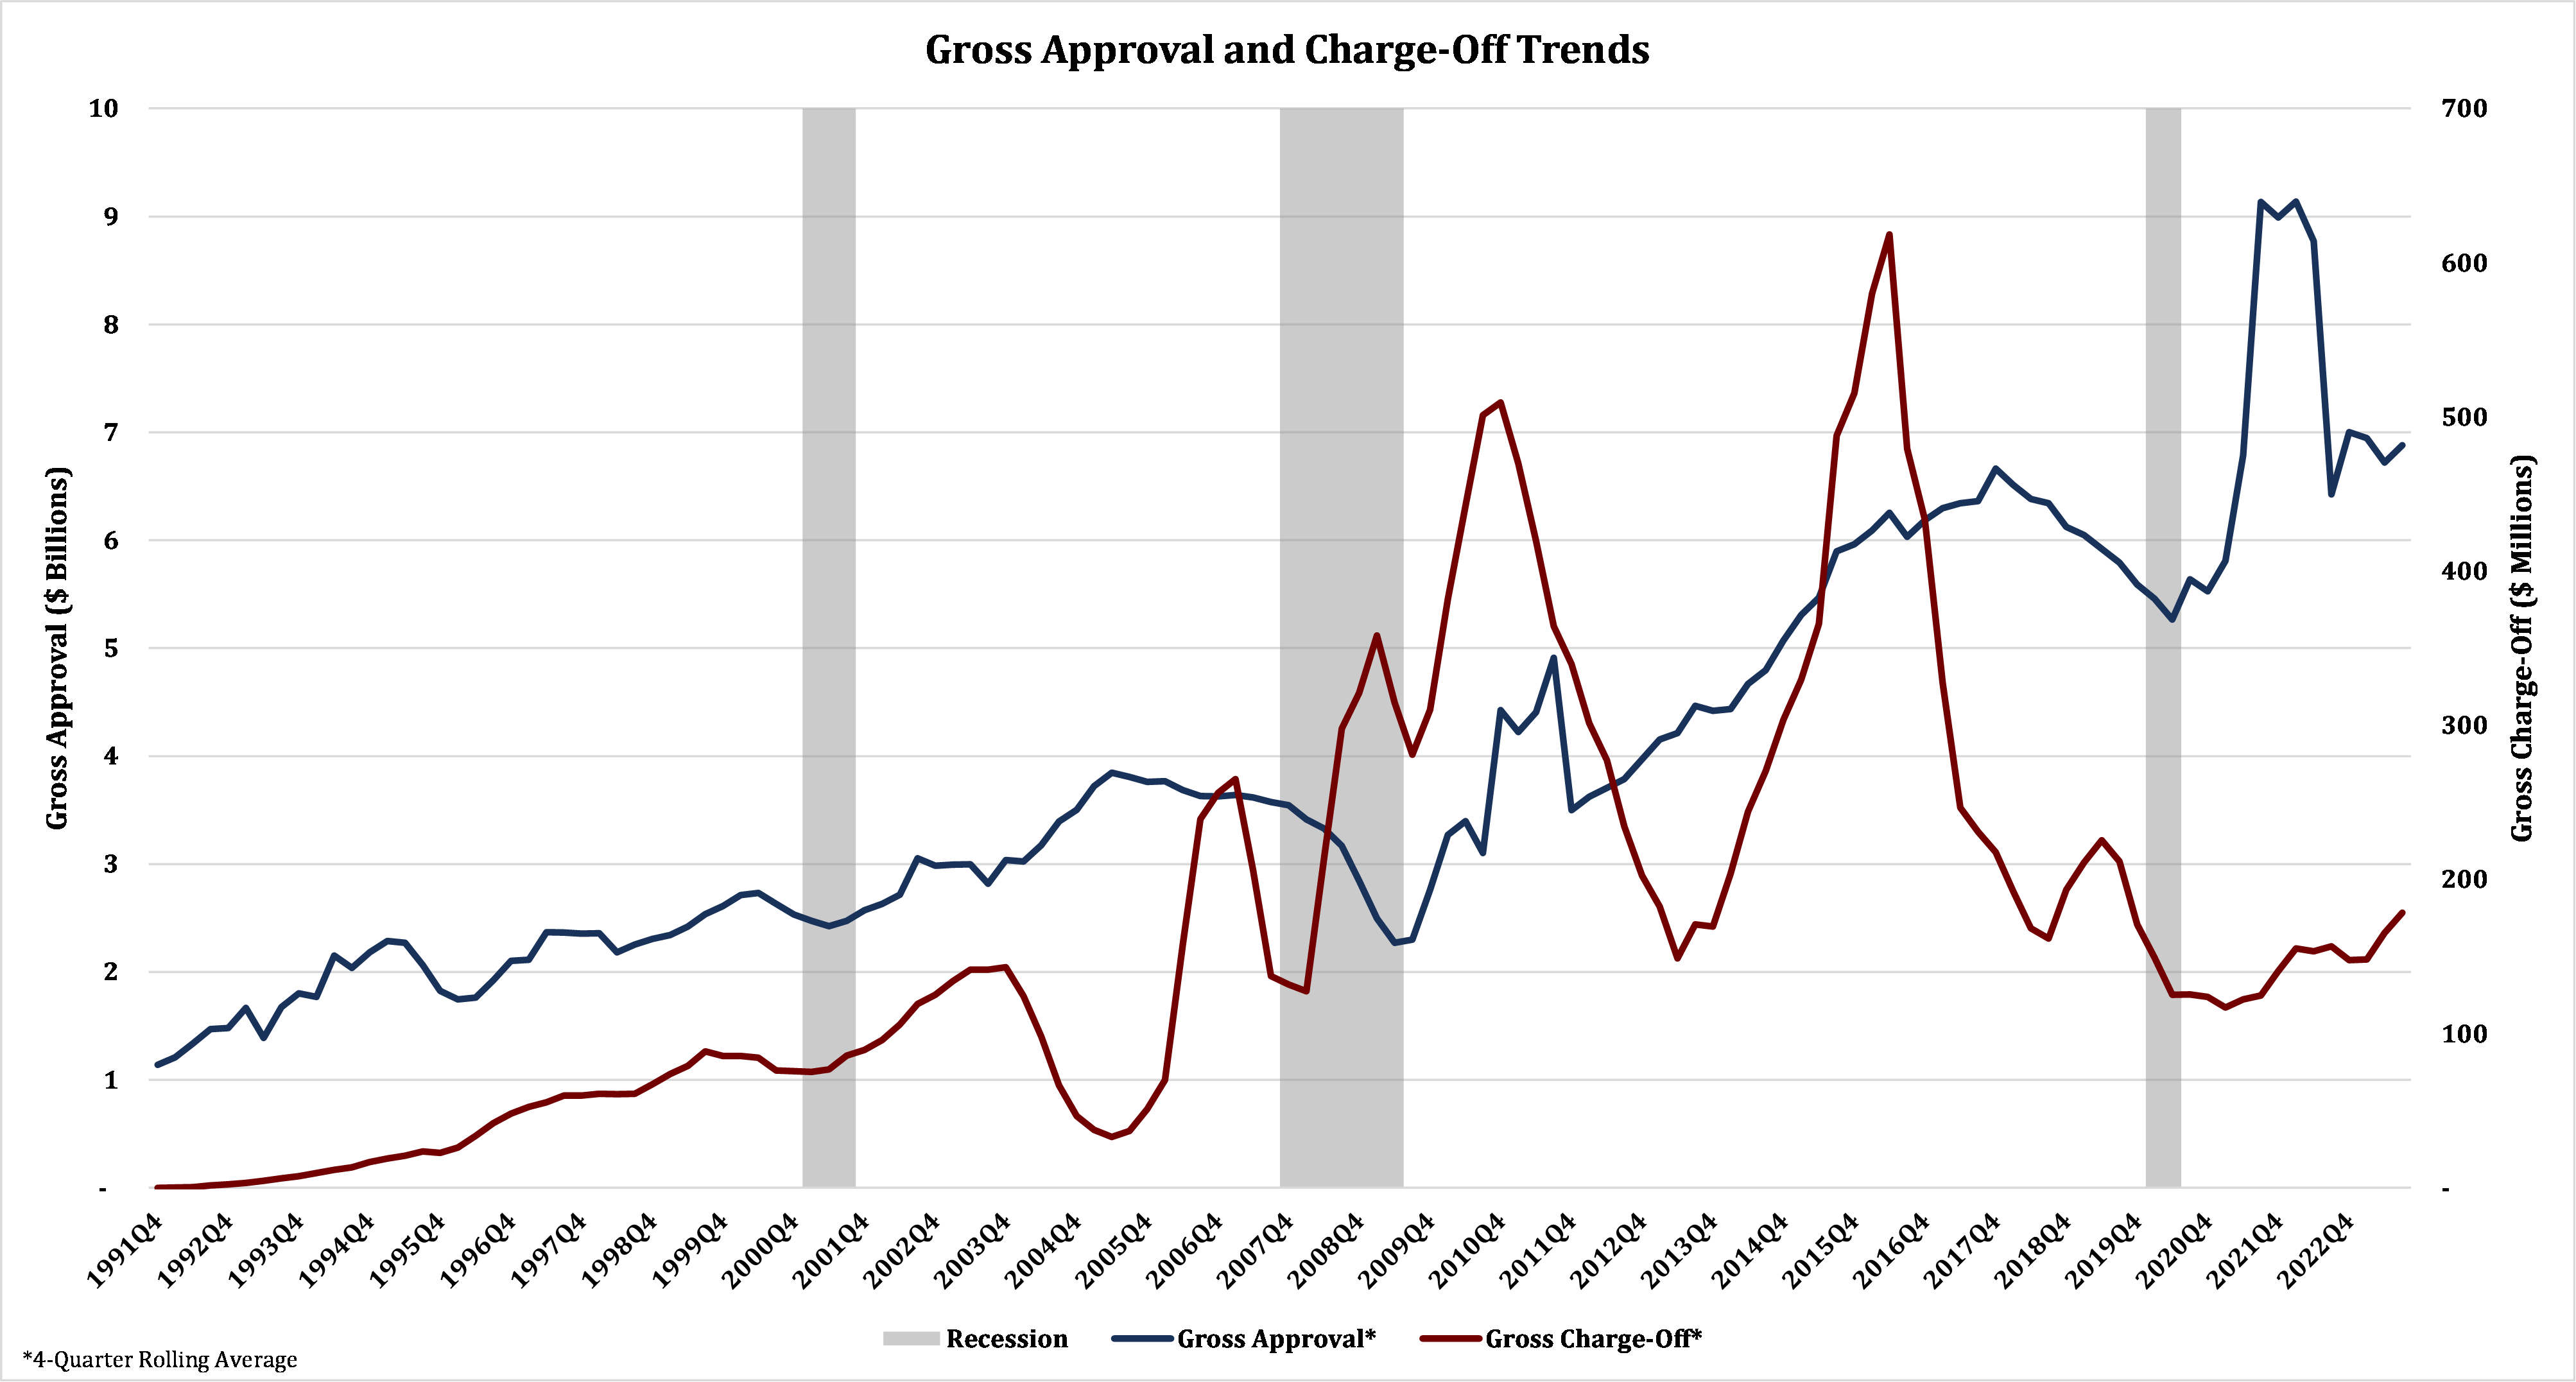
Despite the volatility in charge-offs, the economic recovery subsequent to the 2008 recession led to increased demand for funding. Gross approval amounts began to increase almost immediately after the technical end of the recession, signaling growing confidence among lenders and borrowers. This trend is witnessed through the present day, with recent gross approval amounts far exceeding their peak leading up to the 2008 financial crisis. Charge-offs quickly recovered following the delayed spike in 2015 and have remained relatively stable since. This highlights both the improved economic conditions alongside enhanced risk management coming out of the financial crisis.
This historical analysis highlights the cyclical nature of loan approvals and charge-offs, correlating closely with economic conditions. The 2008 recession and its aftermath illustrate the significant impact economic cycles have on loan performance, with the SBA 7(a) loan program serving as both a gauge for the health of the small business environment and a critical support mechanism during times of economic stress. The data underscores the importance of monitoring the broader economic environment and ensuring sound lending practices to mitigate adverse outcomes.
Sector-Specific Performance Analysis
Analyzing the performance of SBA 7(a) loans within specific sectors offers insights into risk characteristics associated with various industries. This analysis not only highlights sectors that have seen success with SBA 7(a) loans but also identifies those that have not performed as well. By analyzing the various sectors, we can develop insights that will lead to more informed decision making, proactive risk management, and enhanced underwriting criteria.
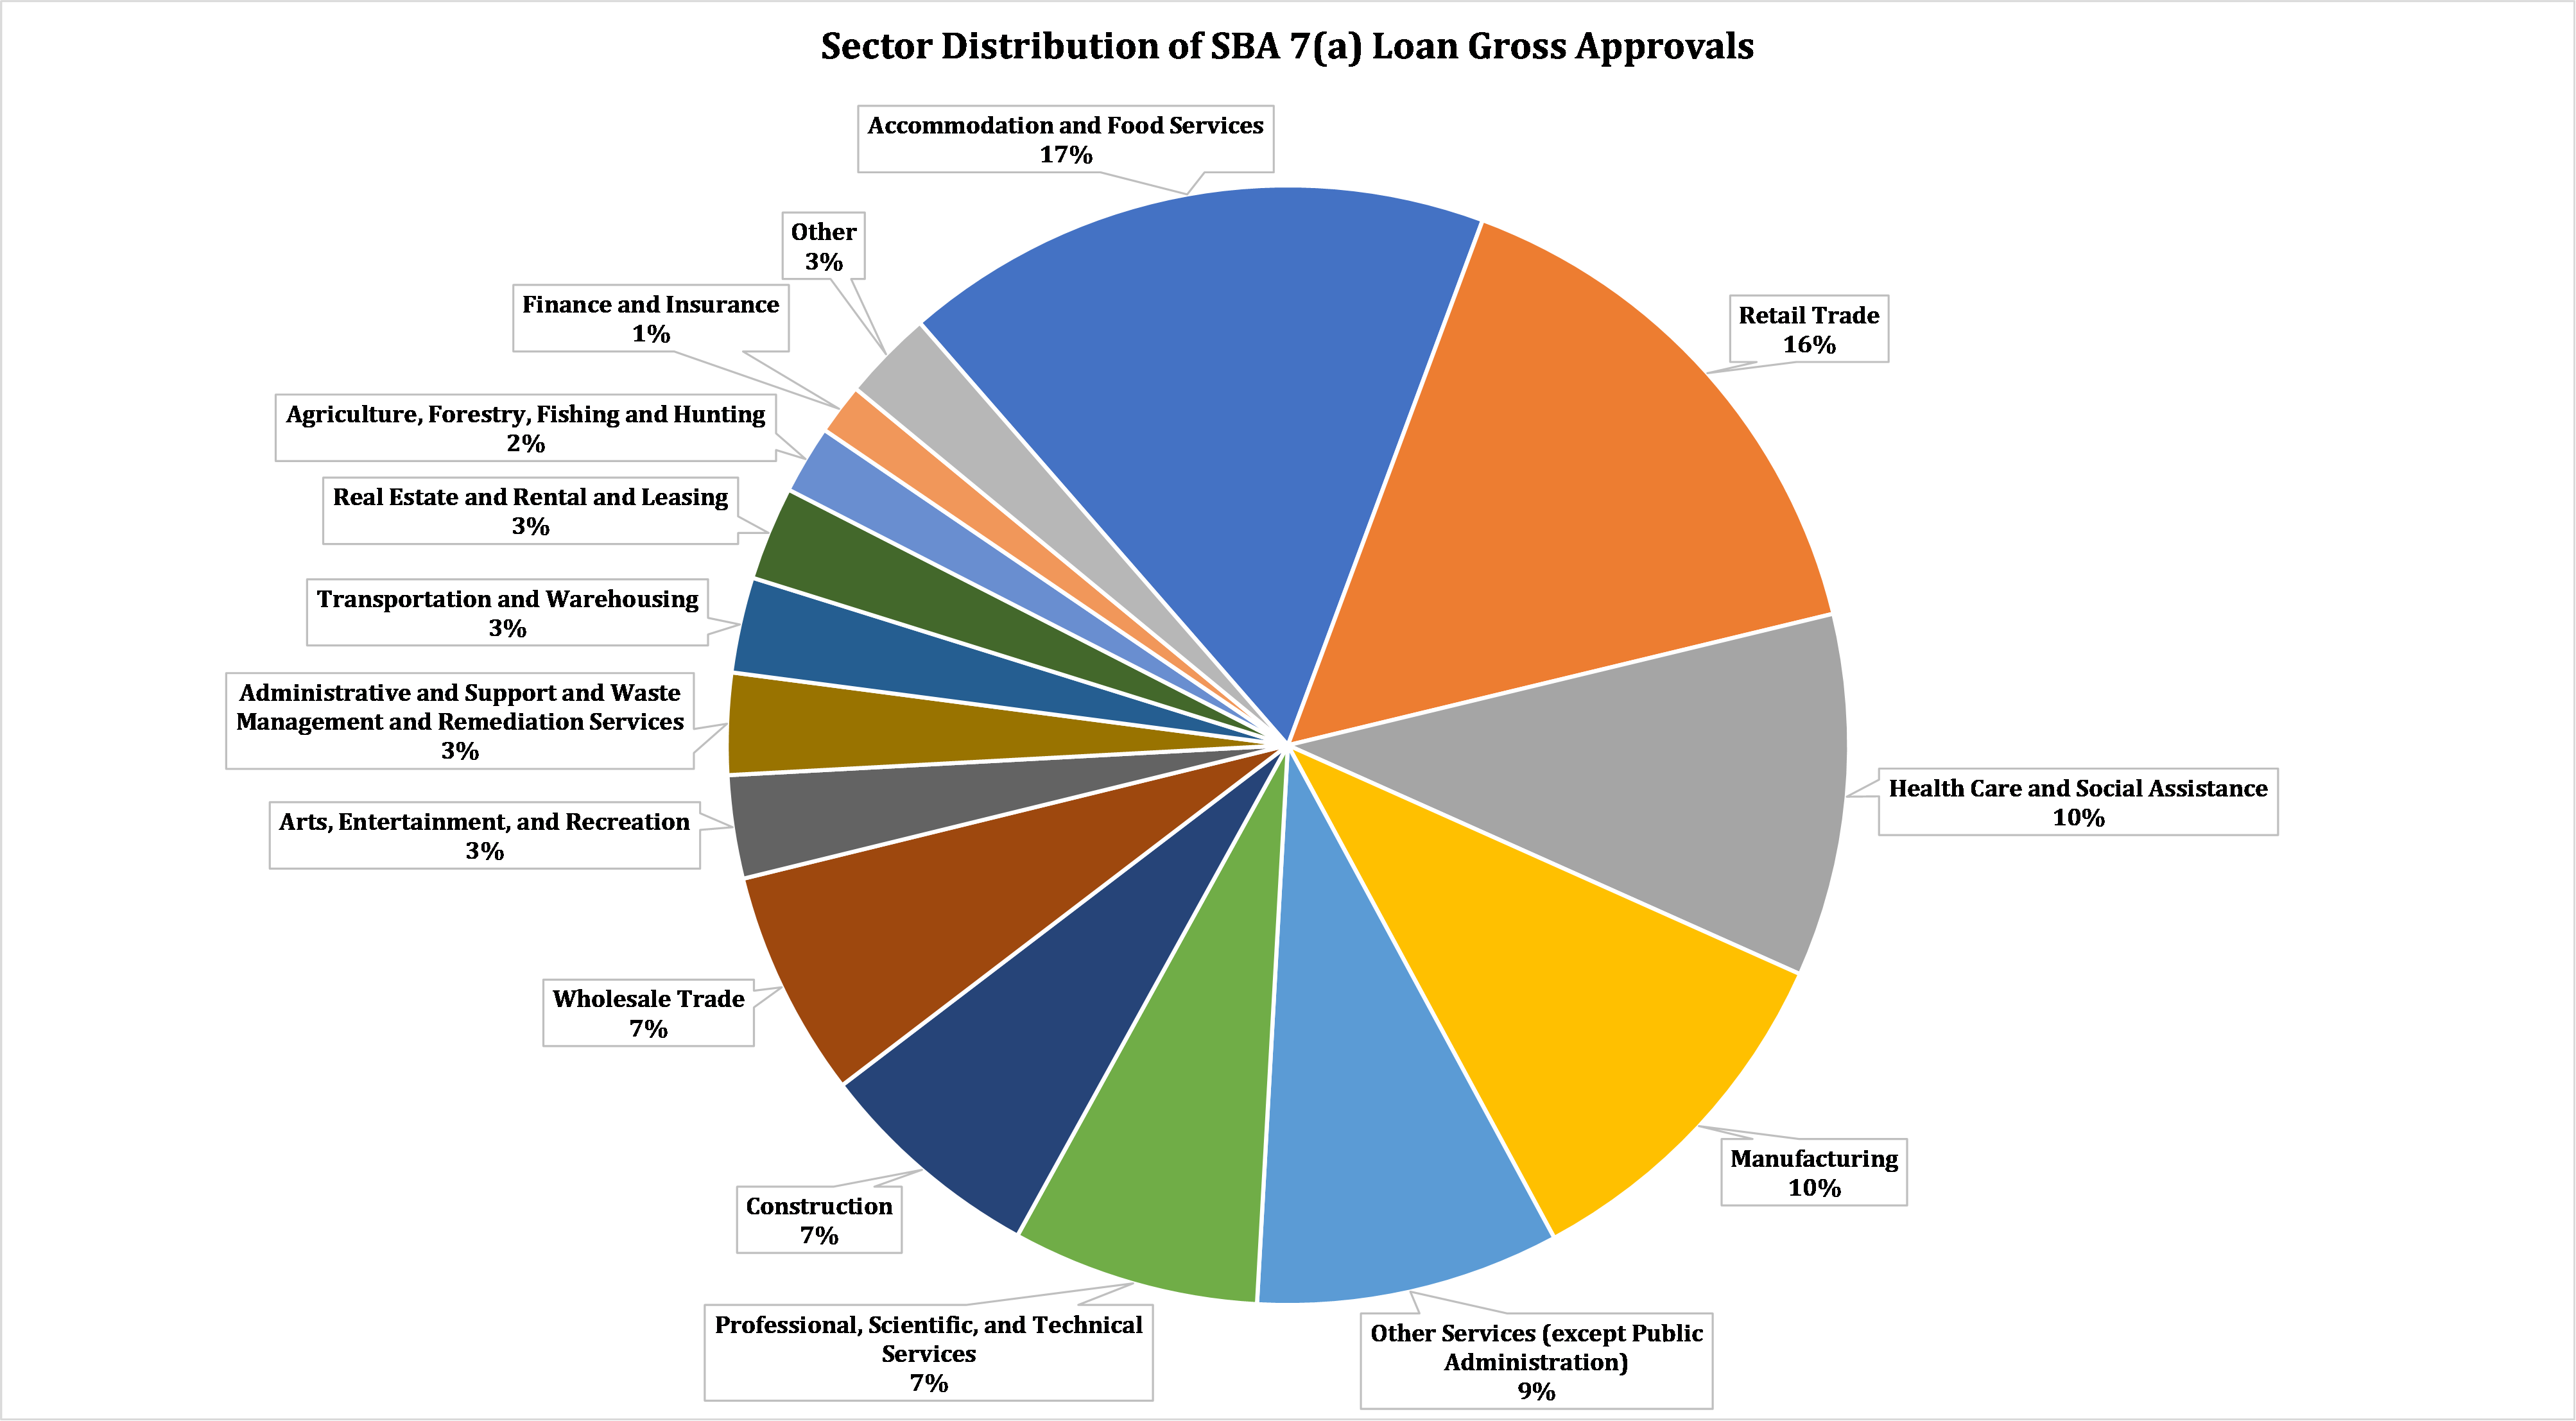
The following graph shows the program-to-date distribution of SBA 7(a) loan gross approvals across the various sectors. As shown below, Accommodation and Food Services represents the largest sector at 17%, with Retail Trade representing the second largest sector at 16%. While the Agriculture, Forestry, Fishing and Hunting and the Finance and Insurance sectors represent just 2% and 1% of gross approvals, respectively, this equates to relatively large dollar amounts – approximately $9.4 billion and $7.0 billion, respectively, in gross approvals.
The following graph shows the program-to-date cumulative gross-charge off rates by sector. As the SBA 7(a) program continued to expand, charge-off trends began to vary by industry. Some sectors, such as Management of Companies and Enterprises, maintained relatively lower and more stable charge-off rates throughout the observed period, suggesting less susceptibility to economic downturns or sector-specific challenges. Other sectors, such as Retail Trade, exhibited a much higher and more volatile charge-off rate. Around 2007-2008, many sectors display a sharp increase in charge-off rates, with a gradual recovery thereafter.
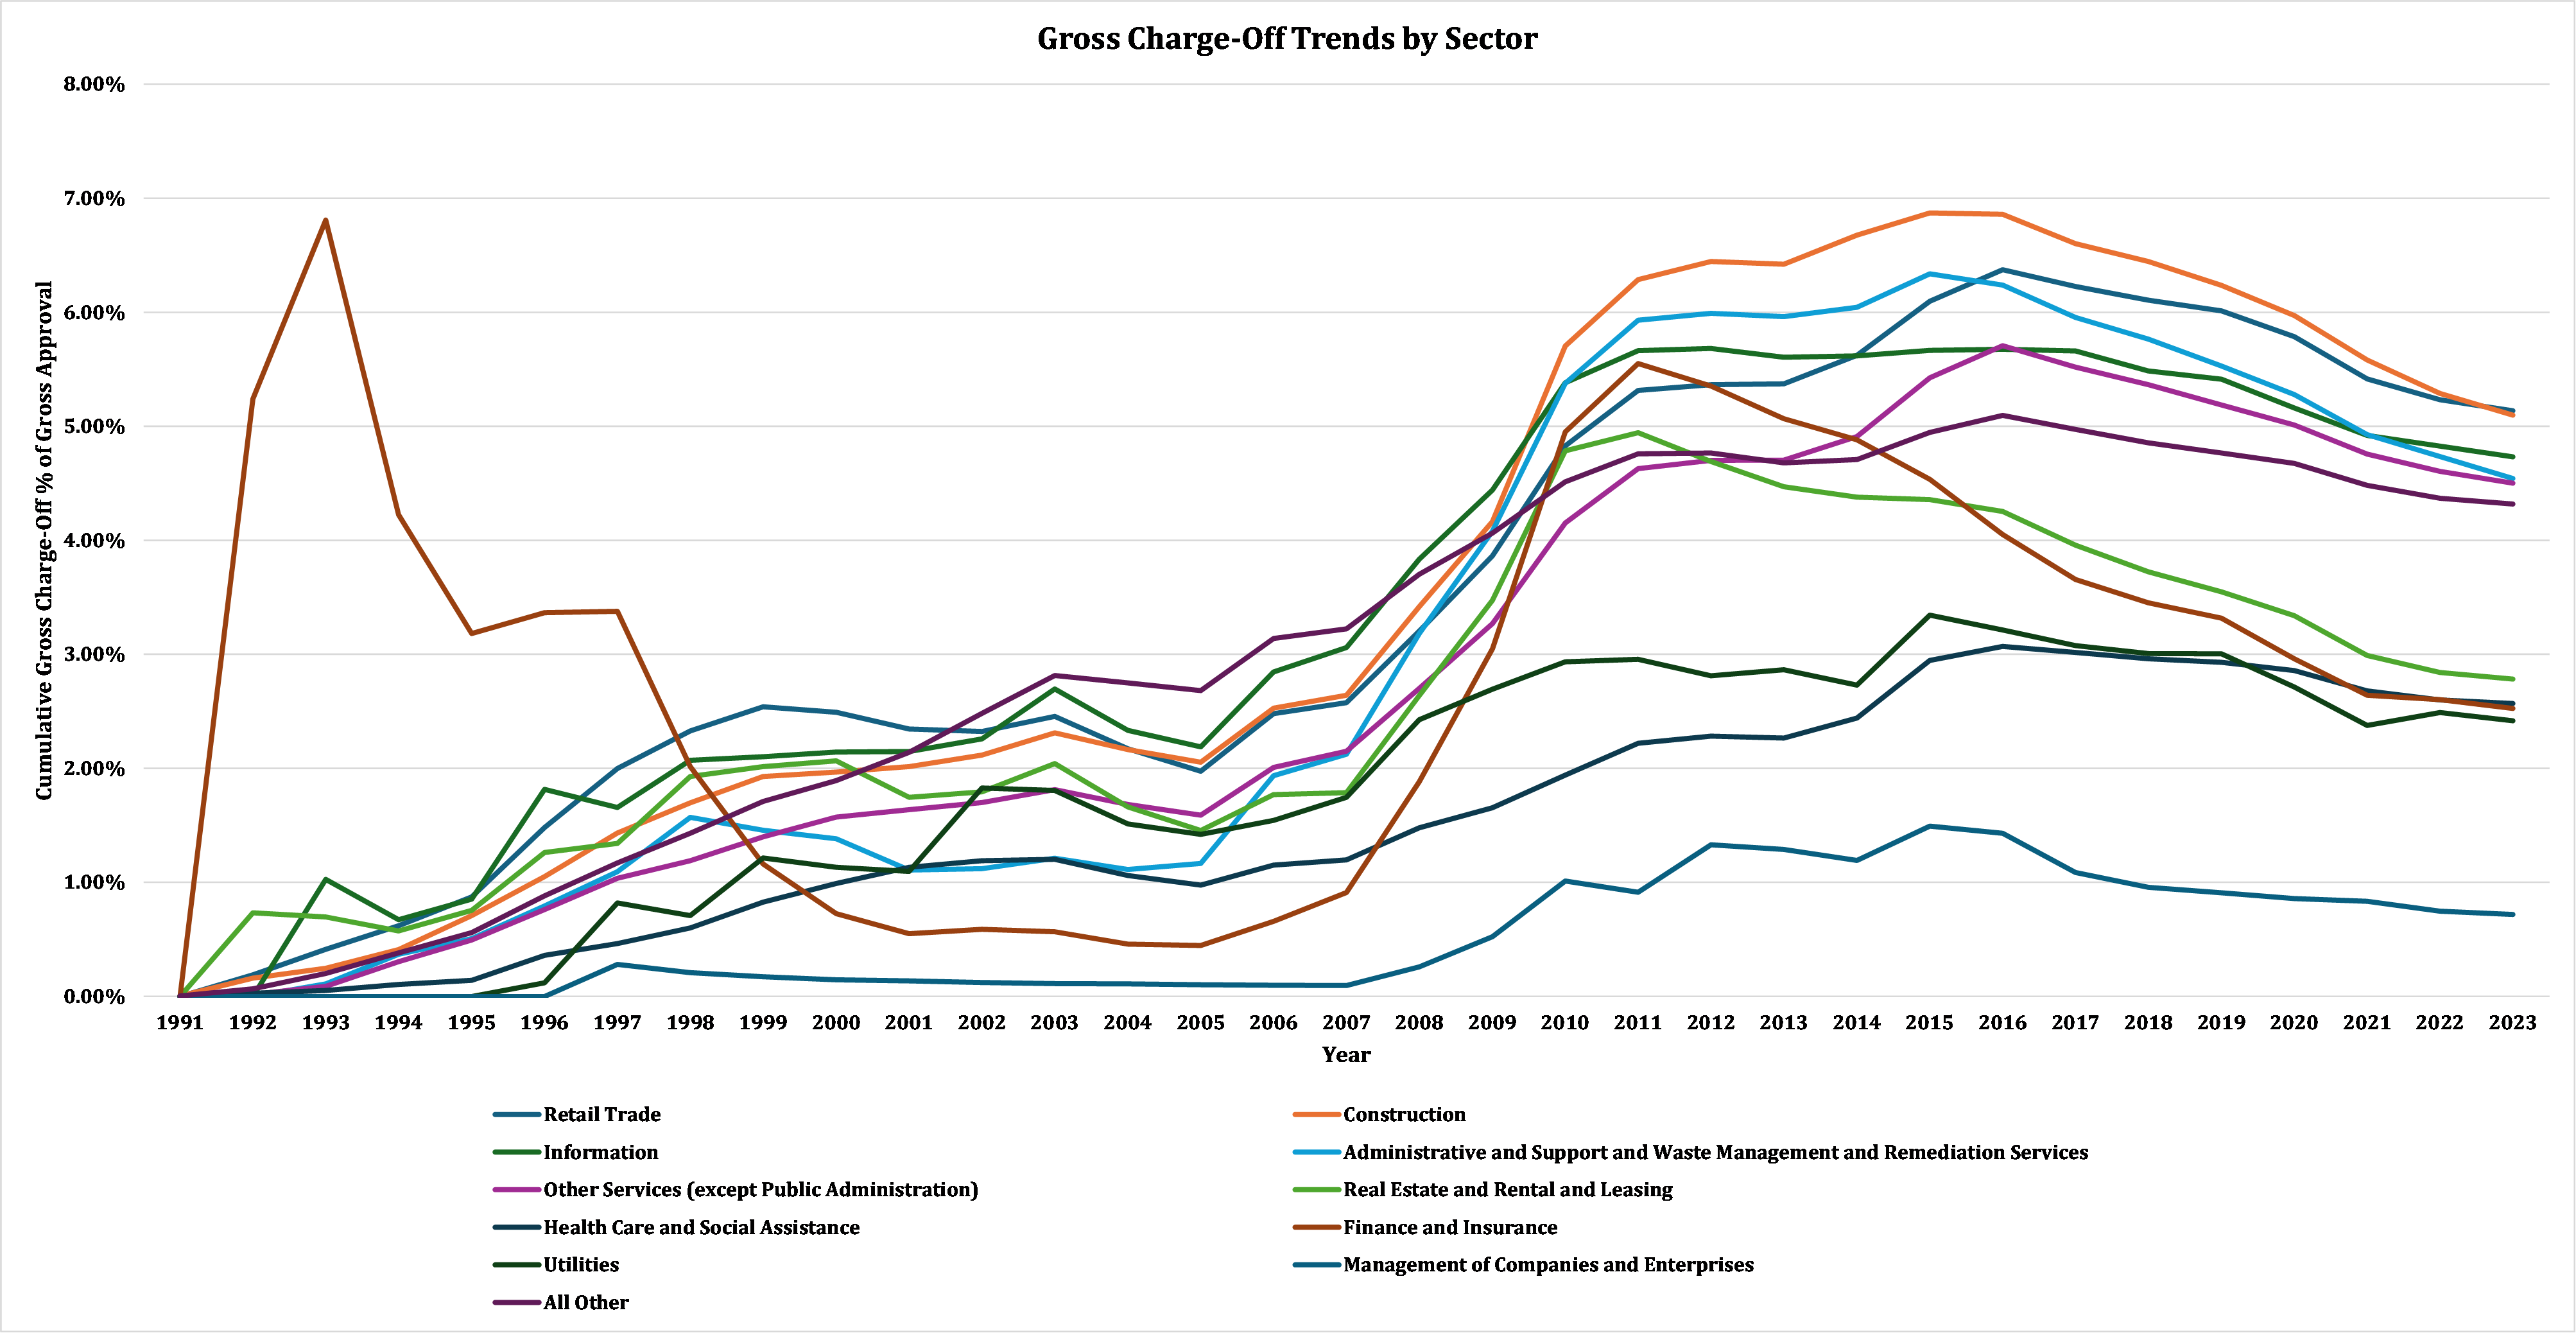
For this analysis, we have focused on the three best performing sectors and three worst performing sectors, with performance as a percentage being determined by gross charge-off amounts as a percentage of gross approvals and sectors as determined by the North American Industry Classification System, or NAICS.
Best Performing Sectors
Management of Companies and Enterprises
The sector that exhibits the best performance is the Management of Companies and Enterprises sector. This sector includes establishments that control companies or influence management decisions through holding securities or equity interests, and those managing and overseeing company operations, focusing on strategic planning and decision-making. This sector achieves economies of scale by centralizing corporate activities that might otherwise be performed internally across various industries.
The following graph displays the yearly gross approval amounts as well as the cumulative gross charge-off amounts as a percentage of gross approval amounts. While the gross approval amounts associated with this sector make up only 0.08% of the total SBA 7(a) program, the trends in gross approval amounts and charge-offs highlight its stability. The low charge-off rates despite the fluctuating gross approval amounts and changes in the macroeconomic environment indicate a resiliency uncommon to many sectors. Gross approval amounts in this sector increased to $10.1 million by 1997 then gradually decreased thereafter until 2009, where demand for funding in this sector increased rapidly to a peak of $56.6 million in 2017. Since then, gross approvals in this category have fluctuated, reaching $16.8 million in 2023.
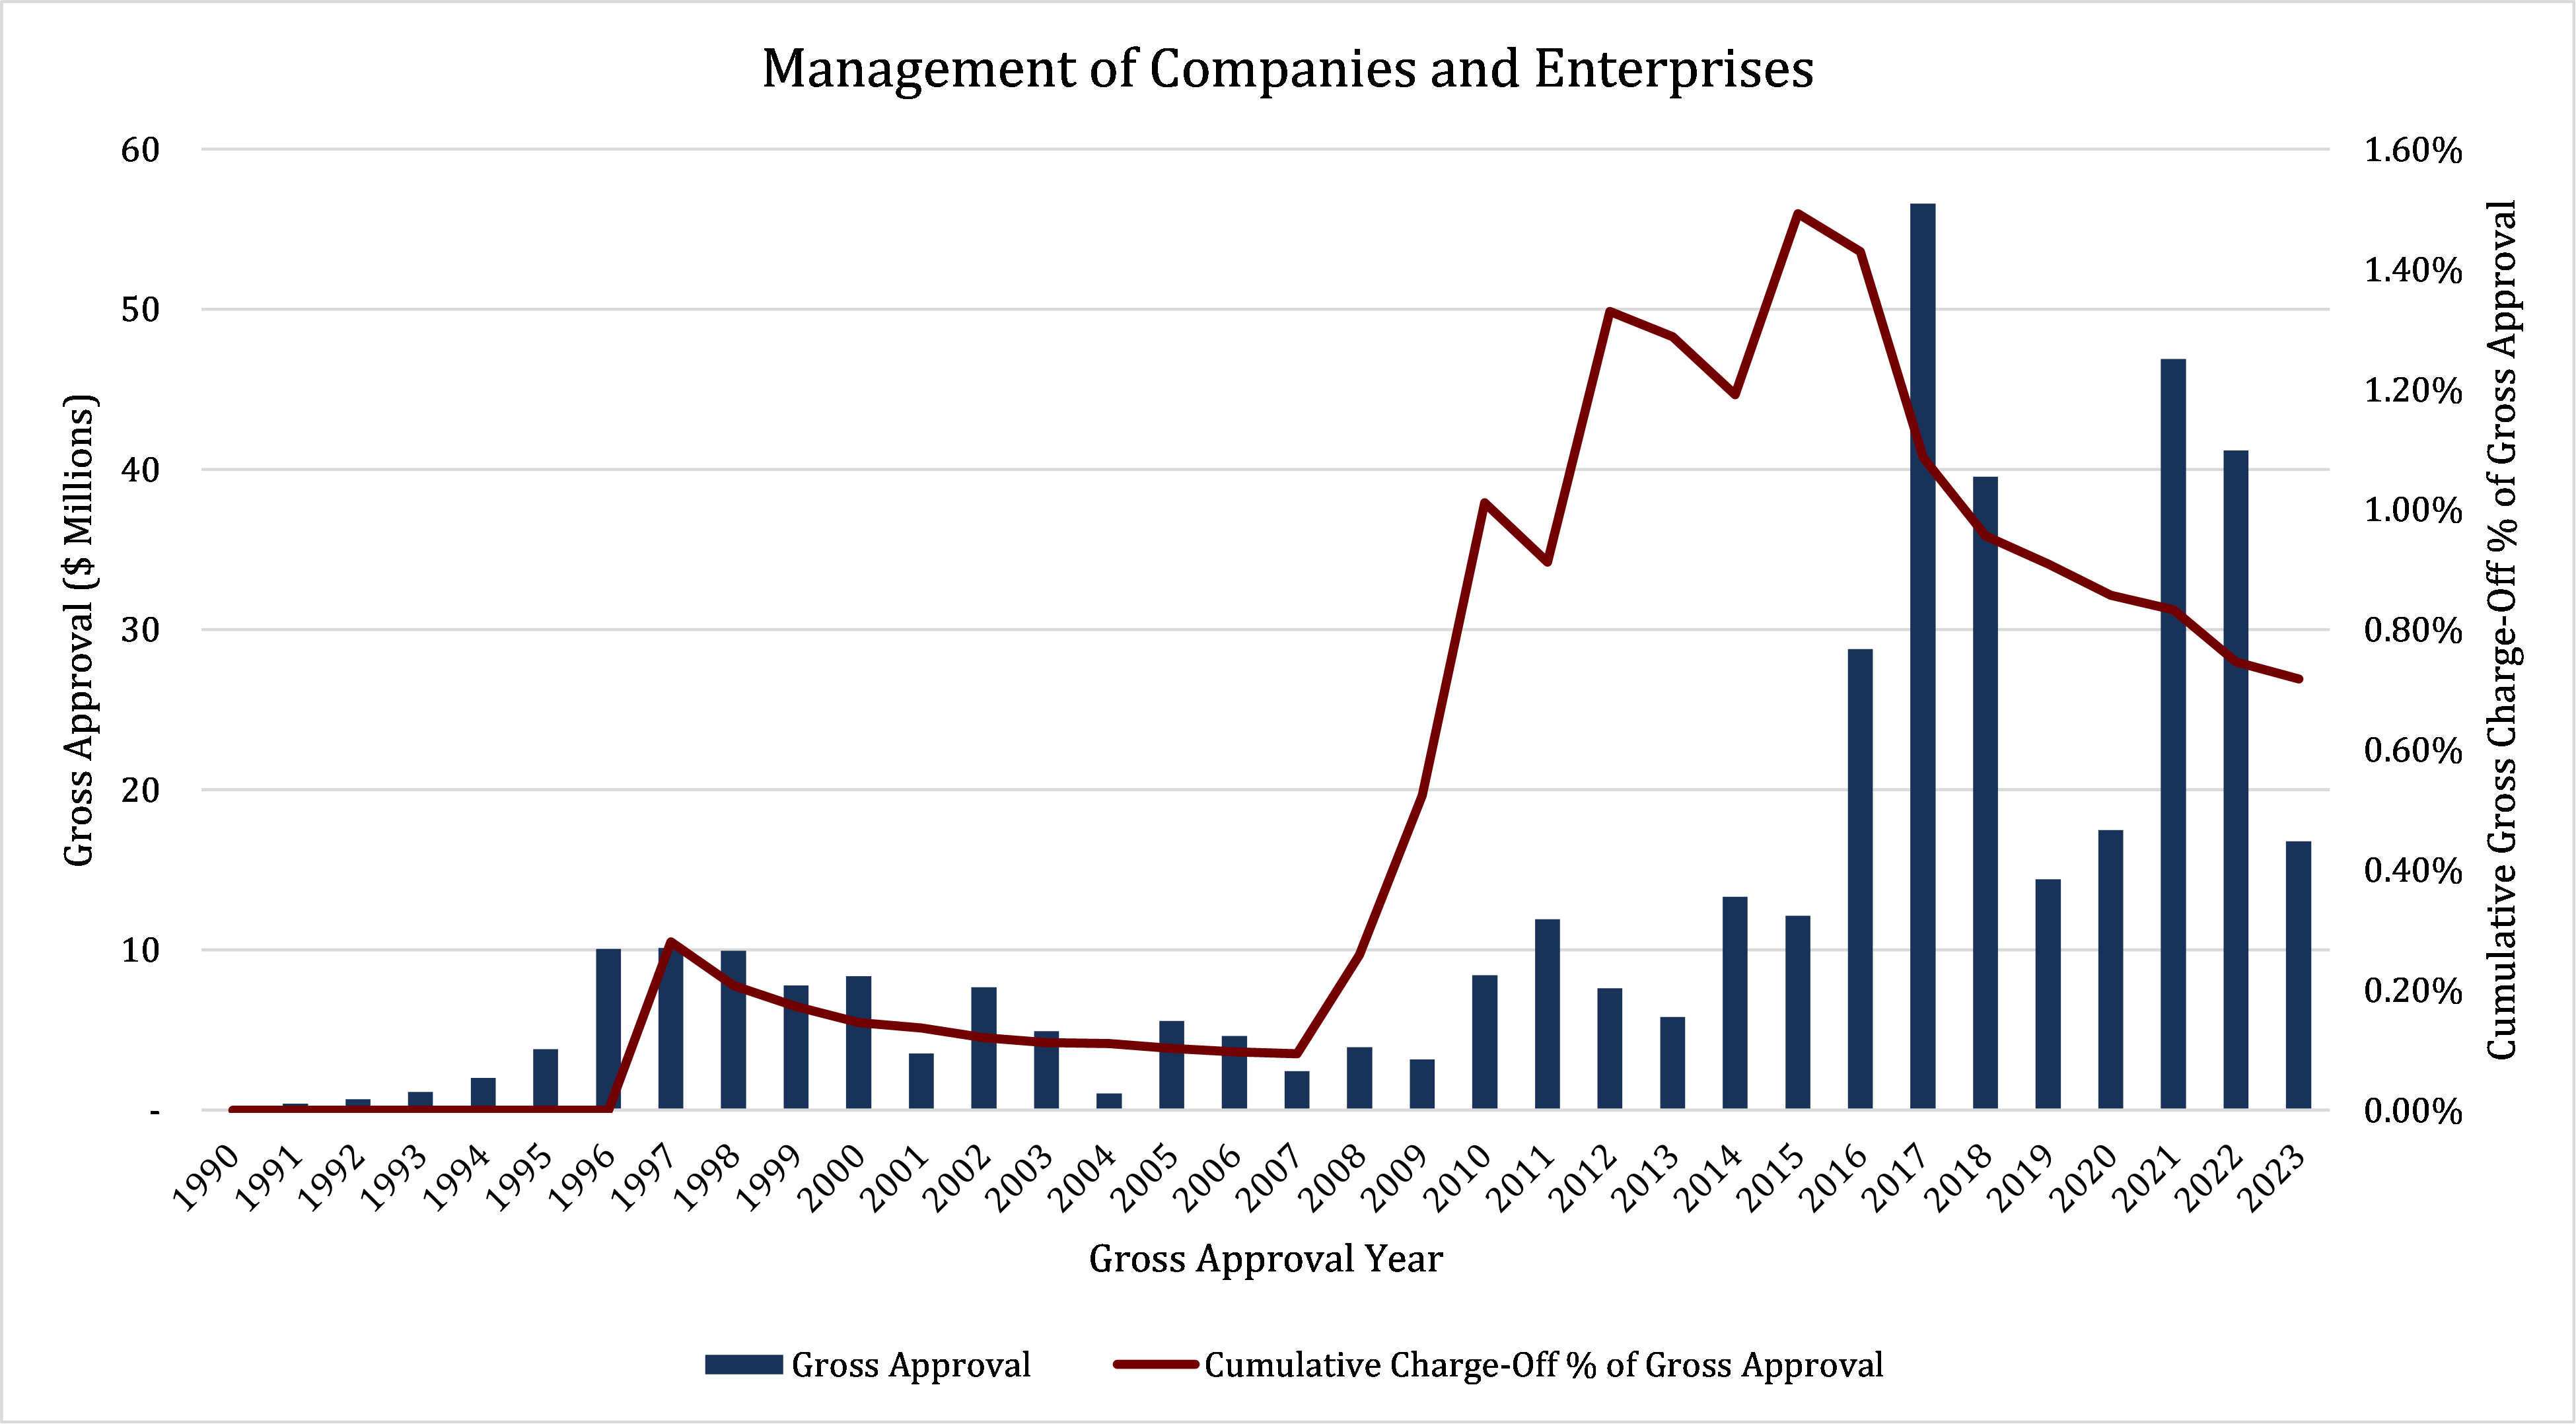
Despite the increased reliance on SBA 7(a) financing in this sector, the cumulative gross charge-off percentage has remained within a narrow band below 1.50%. The general increase over time does indicate some level of risk; however, when viewed in the context of rising gross approval amounts and the broader economy, the performance of this sector reflects the underlying approach of companies within the sector – leveraging financing for growth and stability.
Utilities
Another sector exhibiting relatively strong performance is the Utilities sector. This sector consists of establishments engaged in the provision of electric power, natural gas, steam supply, water supply, and sewage treatment and disposal. Within this sector, the specific activities associated with the utility services provided vary by utility: electric power includes generation, transmission, and distribution; natural gas includes distribution; steam supply includes provision and/or distribution; water supply includes treatment and distribution; and sewage removal includes collection, treatment, and disposal of waste through sewer systems and sewage treatment facilities.
As shown in the following graph, gross approval amounts in this sector exhibit a general upward trend over the period shown. A significant increase in gross approval amounts is noticeable in 2020, with a peak of $49.0 million in 2021 as the economy rebounded from the initial impacts of the COVID-19 pandemic. Simultaneously, the cumulative gross charge-off amounts as a percentage of gross approval amounts gradually increased as SBA 7(a) financing in this sector continued to expand, although the percentage has remained relatively stable since 2010 and was 2.42% at year-end 2023.
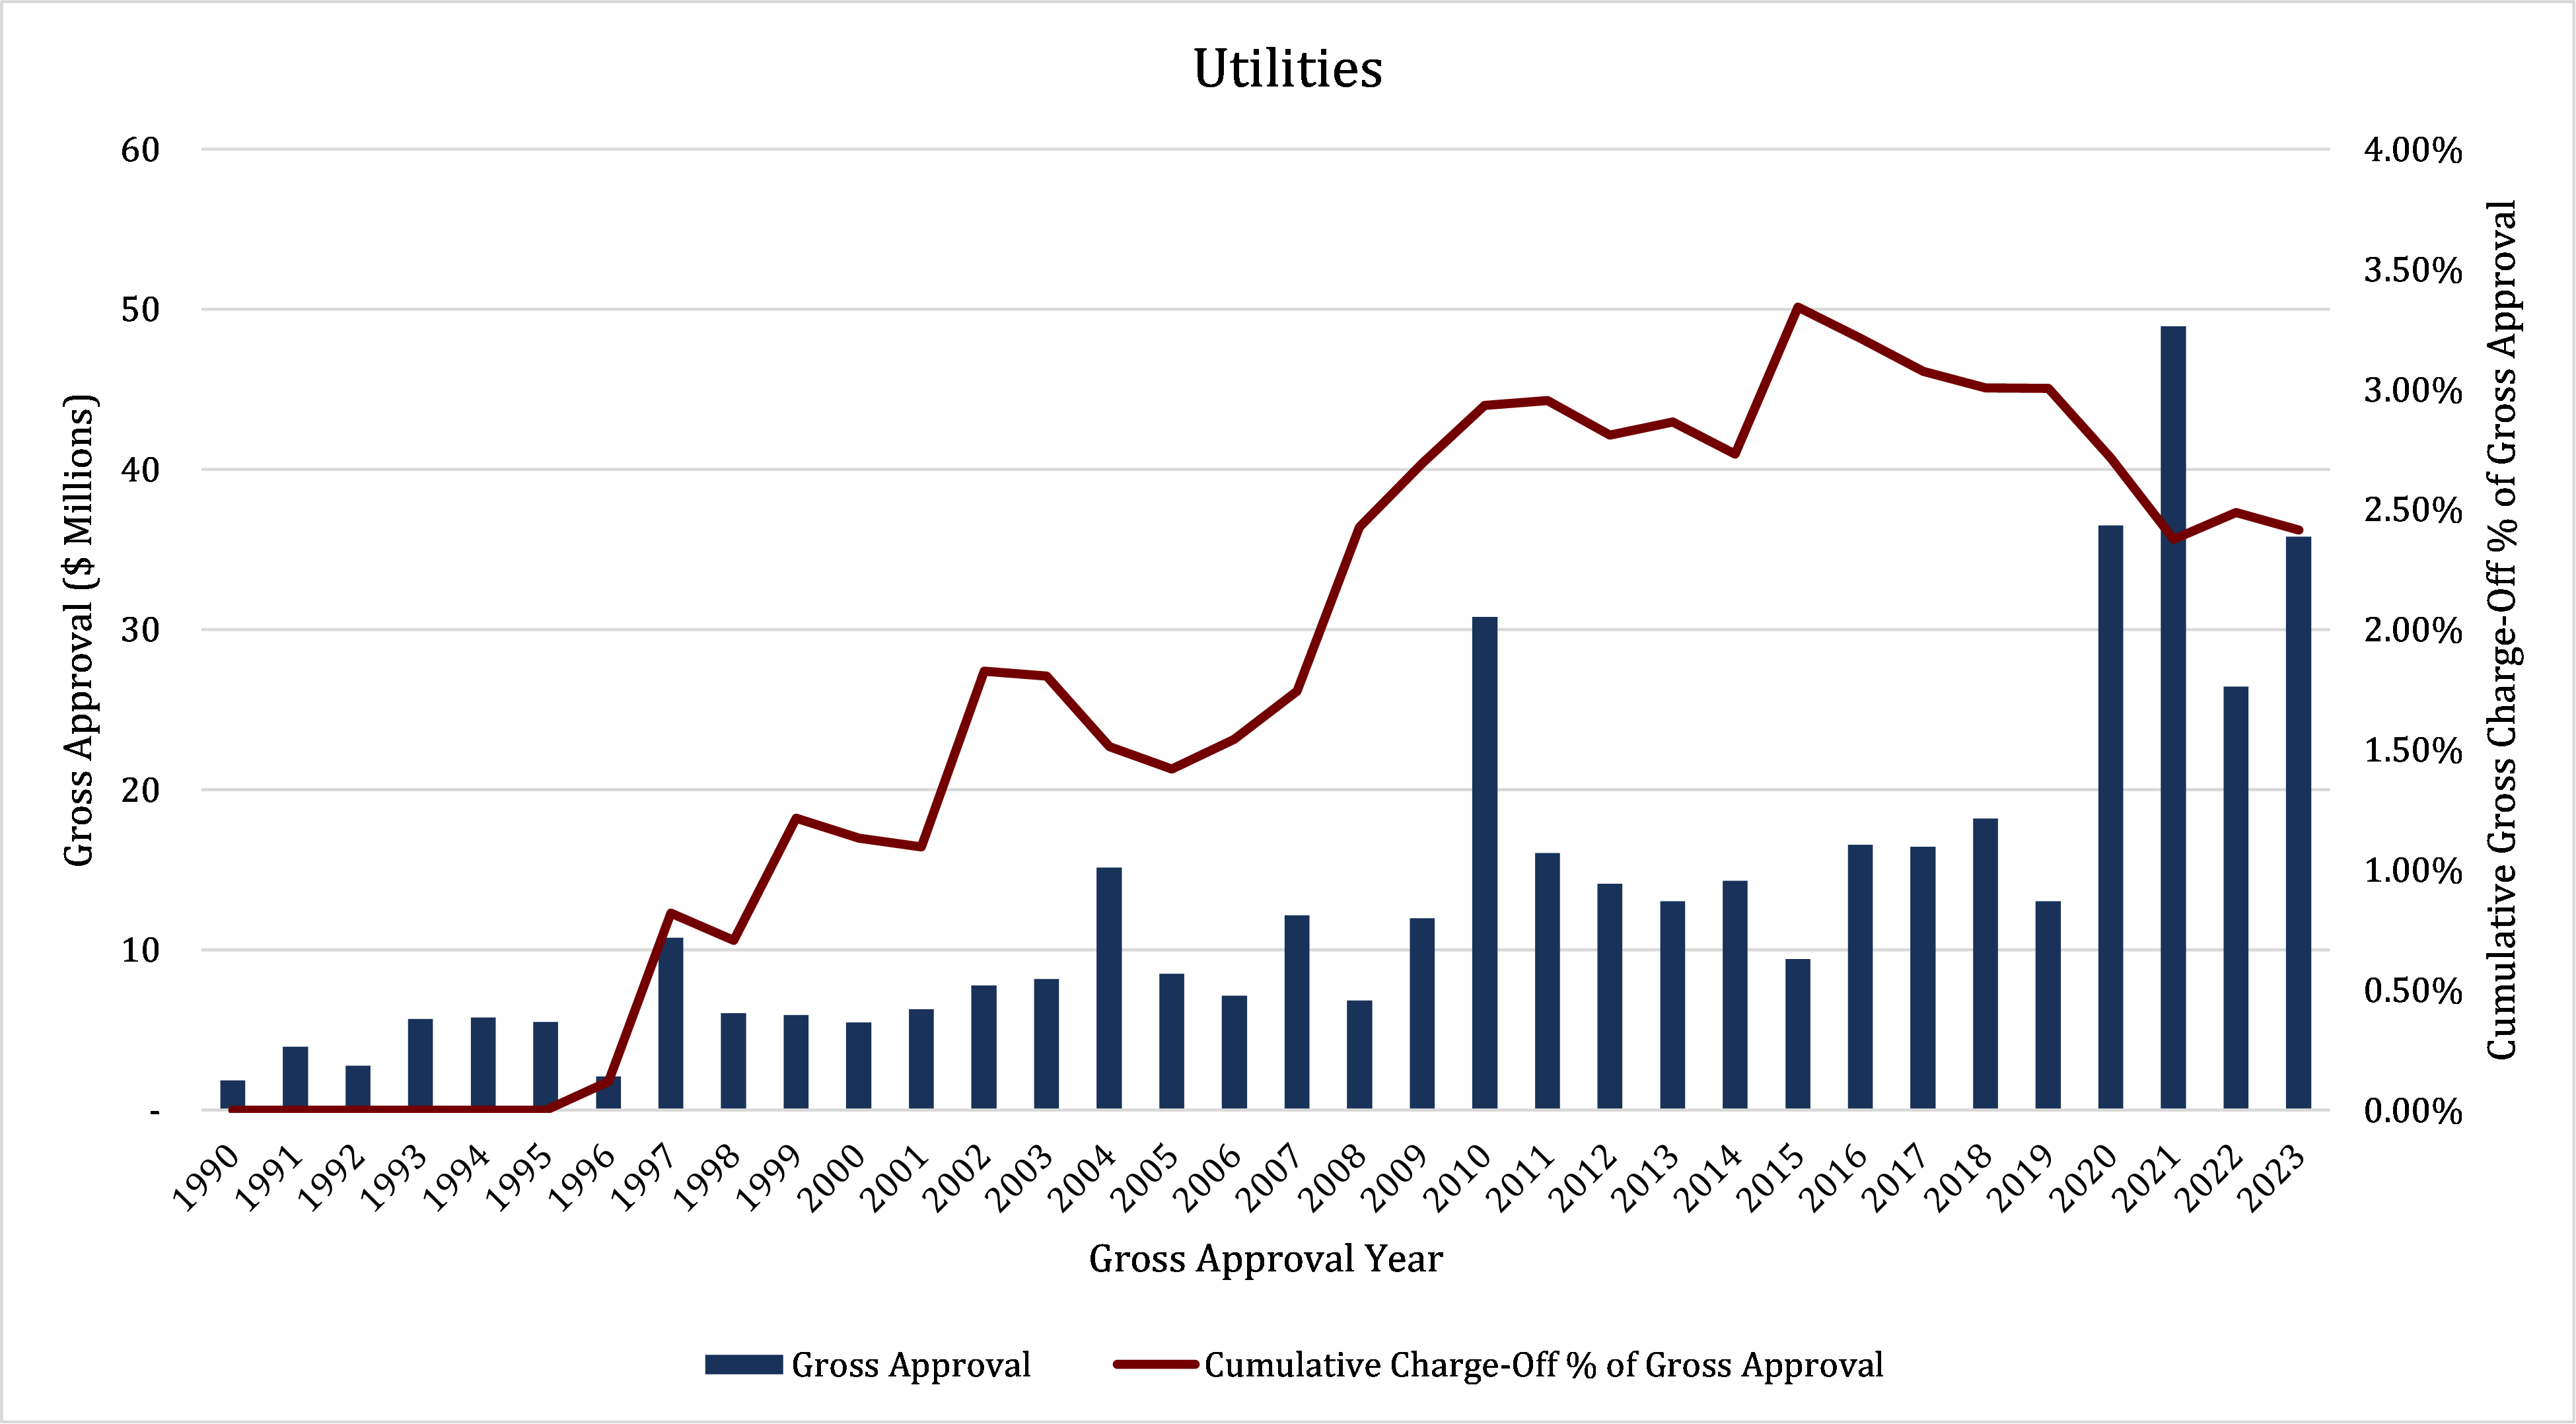
Recent trends within the Utilities sector indicate small but growing reliance on SBA 7(a) funding. While it may be too early to tell if recent economic headwinds will result in a spike in charge-offs within the sector, the sector’s reputation for stability given its involvement with essential services may serve to limit significant deterioration in performance in comparison to riskier sectors.
Finance and Insurance
The last sector we will highlight regarding good performance is the Finance and Insurance sector. This sector consists of establishments primarily engaged in financial transactions (transactions involving the creation, liquidation, or change in ownership of financial assets) and/or in facilitating financial transactions, including banks and credit unions. Three principal types of activities are identified:
- Raising funds by taking deposits and/or issuing securities and, in the process, incurring liabilities.
- Pooling of risk by underwriting insurance and annuities.
- Providing specialized services facilitating or supporting financial intermediation, insurance, and employee benefit programs.
The following graph shows an interesting trend as SBA 7(a) financing in this sector expanded. Gross approval amounts were slow to ramp in the late 1990s and early 2000s, reaching $171.7 million in 2005. Thereafter, gross approval amounts decreased slightly before increasing rapidly to $781.7 million in 2021. Gross approval amounts in 2023 of $421.2 million represent a 46% decrease from the 2021 peak.
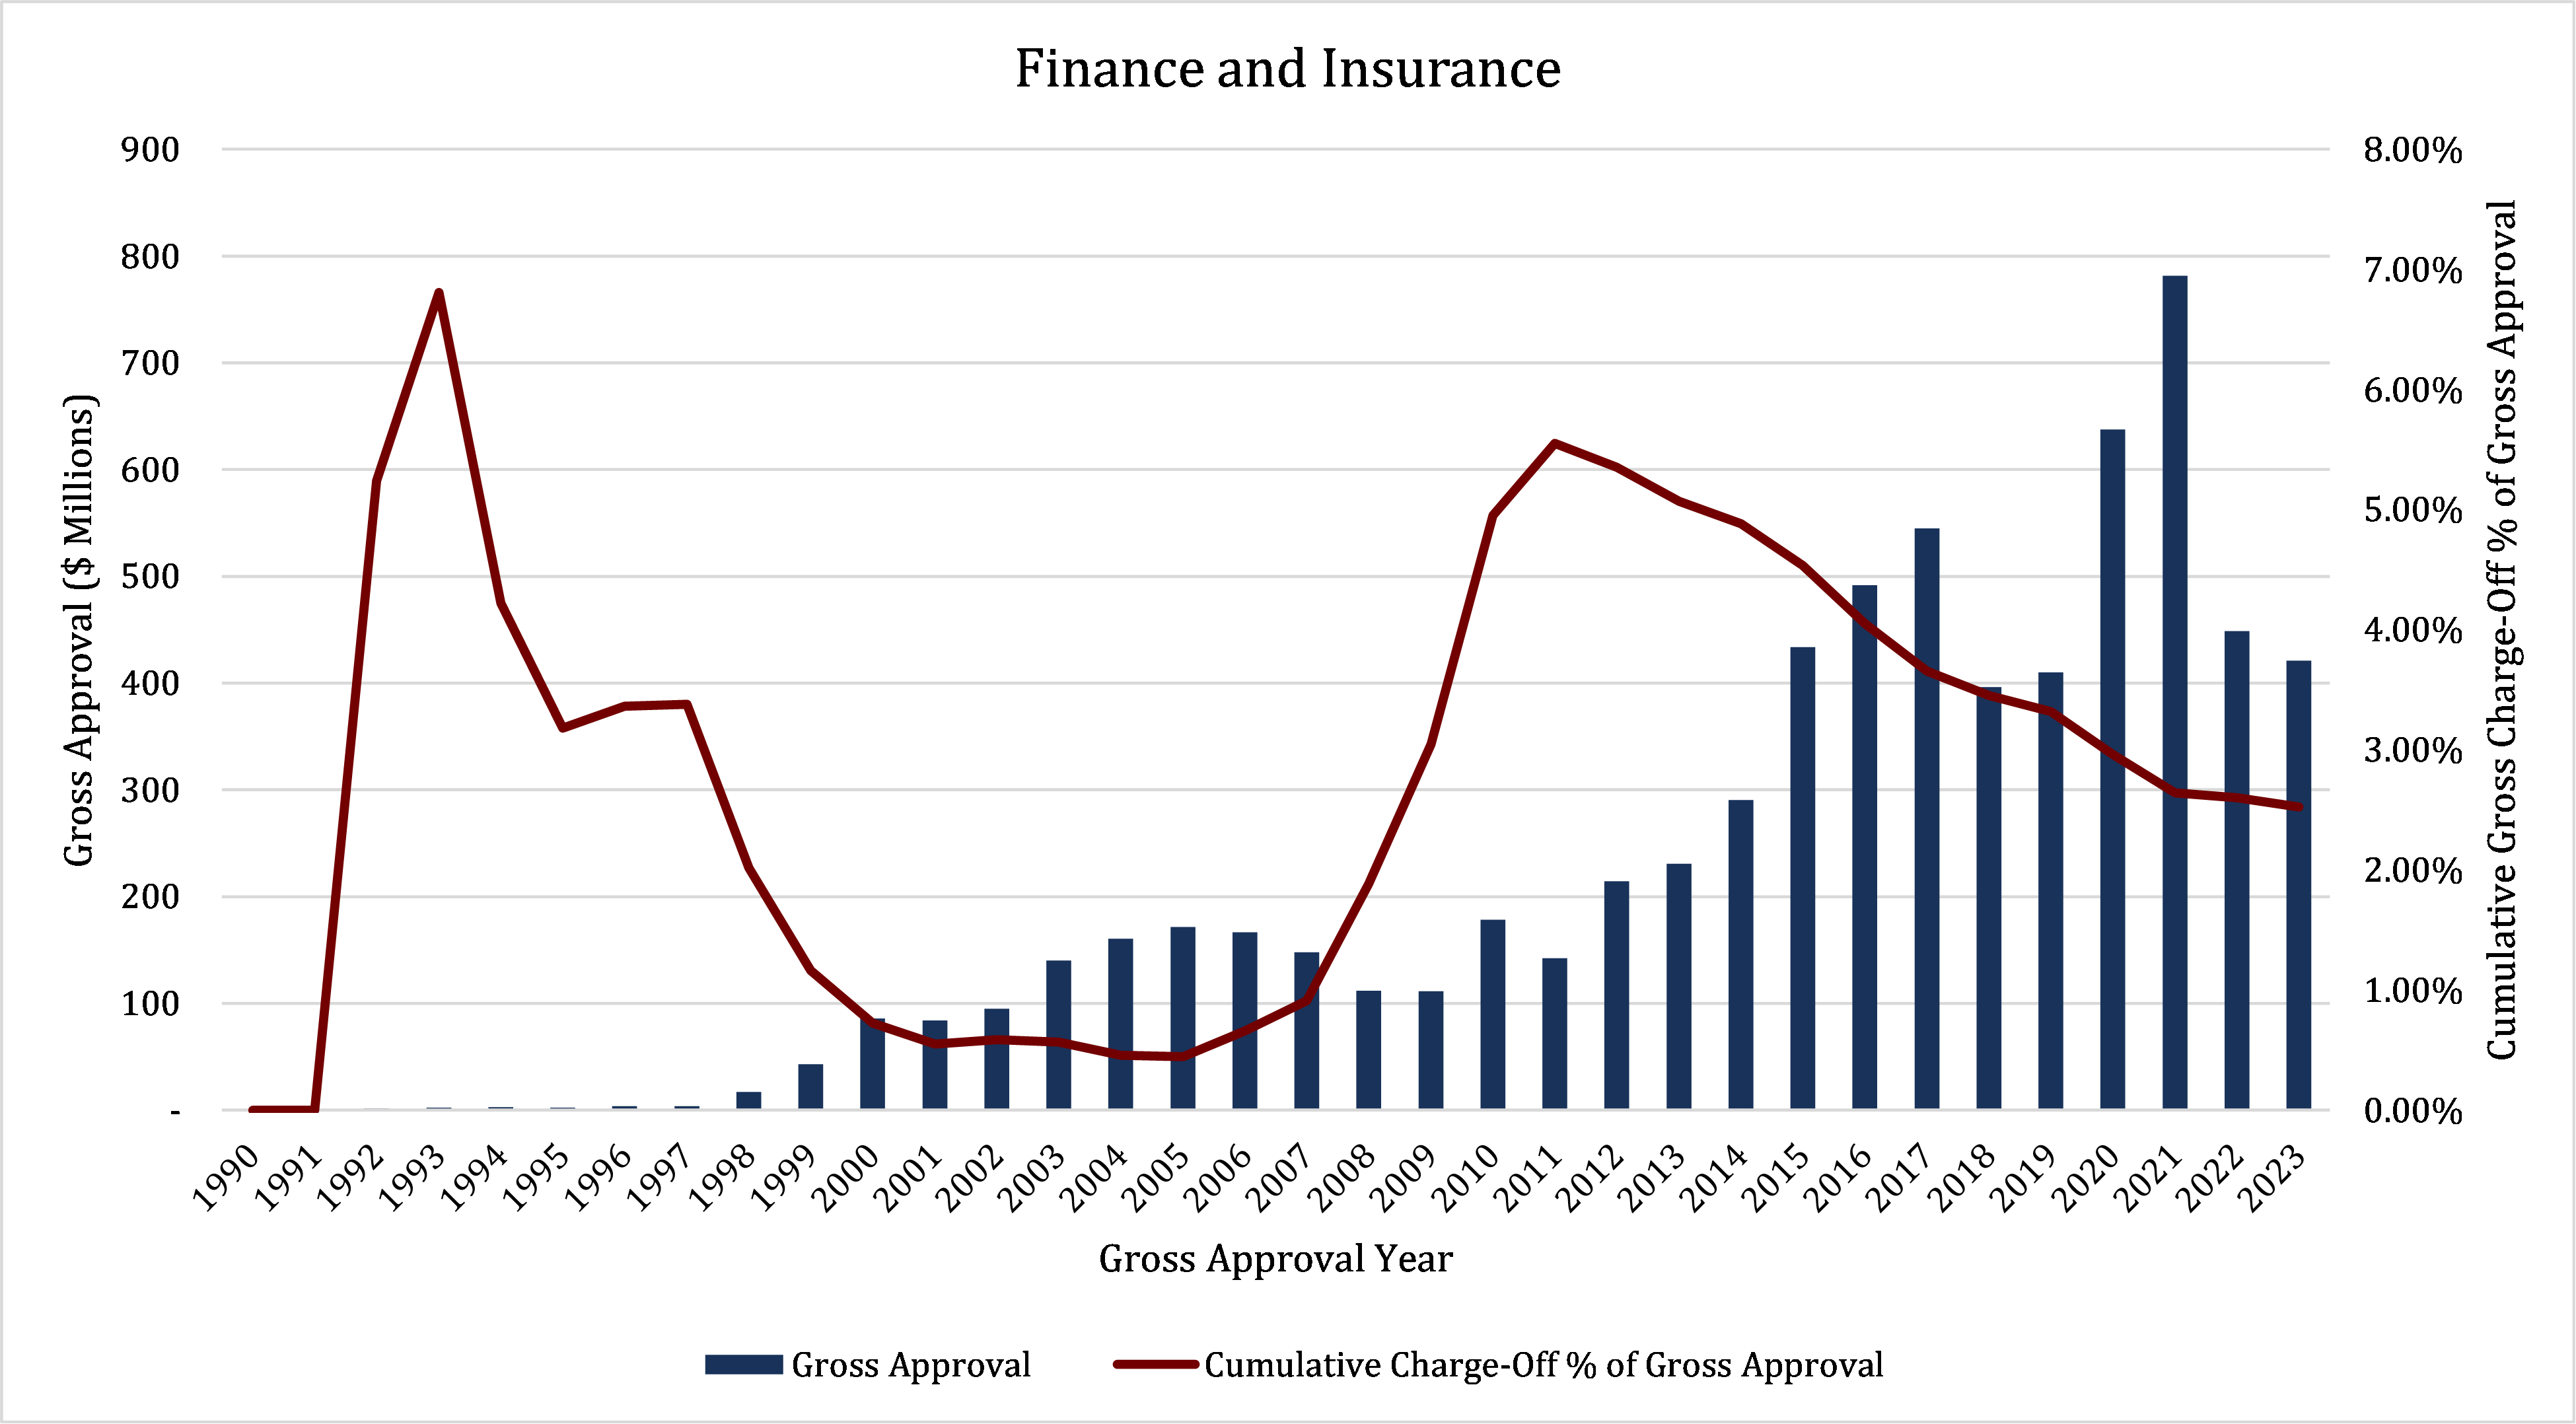
Analyzing the trend in gross charge-offs, it is clear that borrowers in this sector utilizing SBA 7(a) financing initially exhibited outsized risk, as evidenced by the cumulative gross charge-off percentage of 6.81% in 1993. However, it is important to note that only $5.0 million in gross approvals had been granted by 1993 within this sector, highlighting that the risk characteristics of these borrowers were not truly indicative of the sector’s risk. As SBA 7(a) financing in this sector continued to expand, gross charge-offs decreased considerably before ramping up to a peak of 5.55% in 2011 as the economic impacts of the 2008 financial crisis continued to reverberate throughout the sector. Since then, however, gross charge-offs have continued on a downward trend as gross approval amounts continue to expand. While this sector is clearly subject to cyclical fluctuations, recent trends in gross charge-offs demonstrate a relatively subdued level of risk in comparison to other sectors.
Common Characteristics Among Best Performing Sectors
Examining the best performing industries in relation to the SBA 7(a) loan program reveals several common characteristics. Each of these sectors – Management of Companies and Enterprises, Utilities, and Finance and Insurance – provide services that are fundamental to the functioning of the economy. Demand for these services tends to be relatively inelastic, meaning they are needed regardless of economic conditions. Additionally, the regulatory environment around these sectors often results in prudent risk management. Further stability is offered by predictable and stable cash flows, whether from regular utility payments or financial transactions, that ensure consistent revenue. In summary, the best performing industries in the SBA 7(a) program share characteristics that provide stability and growth potential, with essential services and strategic risk management being key to their success.
Worst Performing Industries
Retail Trade
The sector that exhibits the worst performance is the Retail Trade sector. This sector consists of establishments primarily engaged in retailing merchandise, generally without transformation, and rendering services incidental to the sale of merchandise. The retailing process is the final step in the distribution of merchandise, with retailers offering products in small quantities through various channels, including physical stores, online platforms, and direct sales methods. This sector includes diverse retailers who also may offer after-sales services like repairs and installations.
The following graph highlights the cyclicality of the Retail Trade sector and gives an indication to the relative risk of the sector. Gross approval amounts in this category quickly increased as the SBA 7(a) loan program continued to expand, and this sector continues to be one of the most prominent, accounting for 14% of cumulative gross approval amounts. Prior to the 2008 financial crisis, gross approvals reached a relative peak of $3.0 billion in 2005 before decreasing to $1.7 billion in 2009. Since then, gross approval amounts have continued to increase and reached $3.7 billion in 2023, after a spike to $5.6 billion in 2021 as the economy rebounded from the initial impacts of the COVID-19 pandemic.
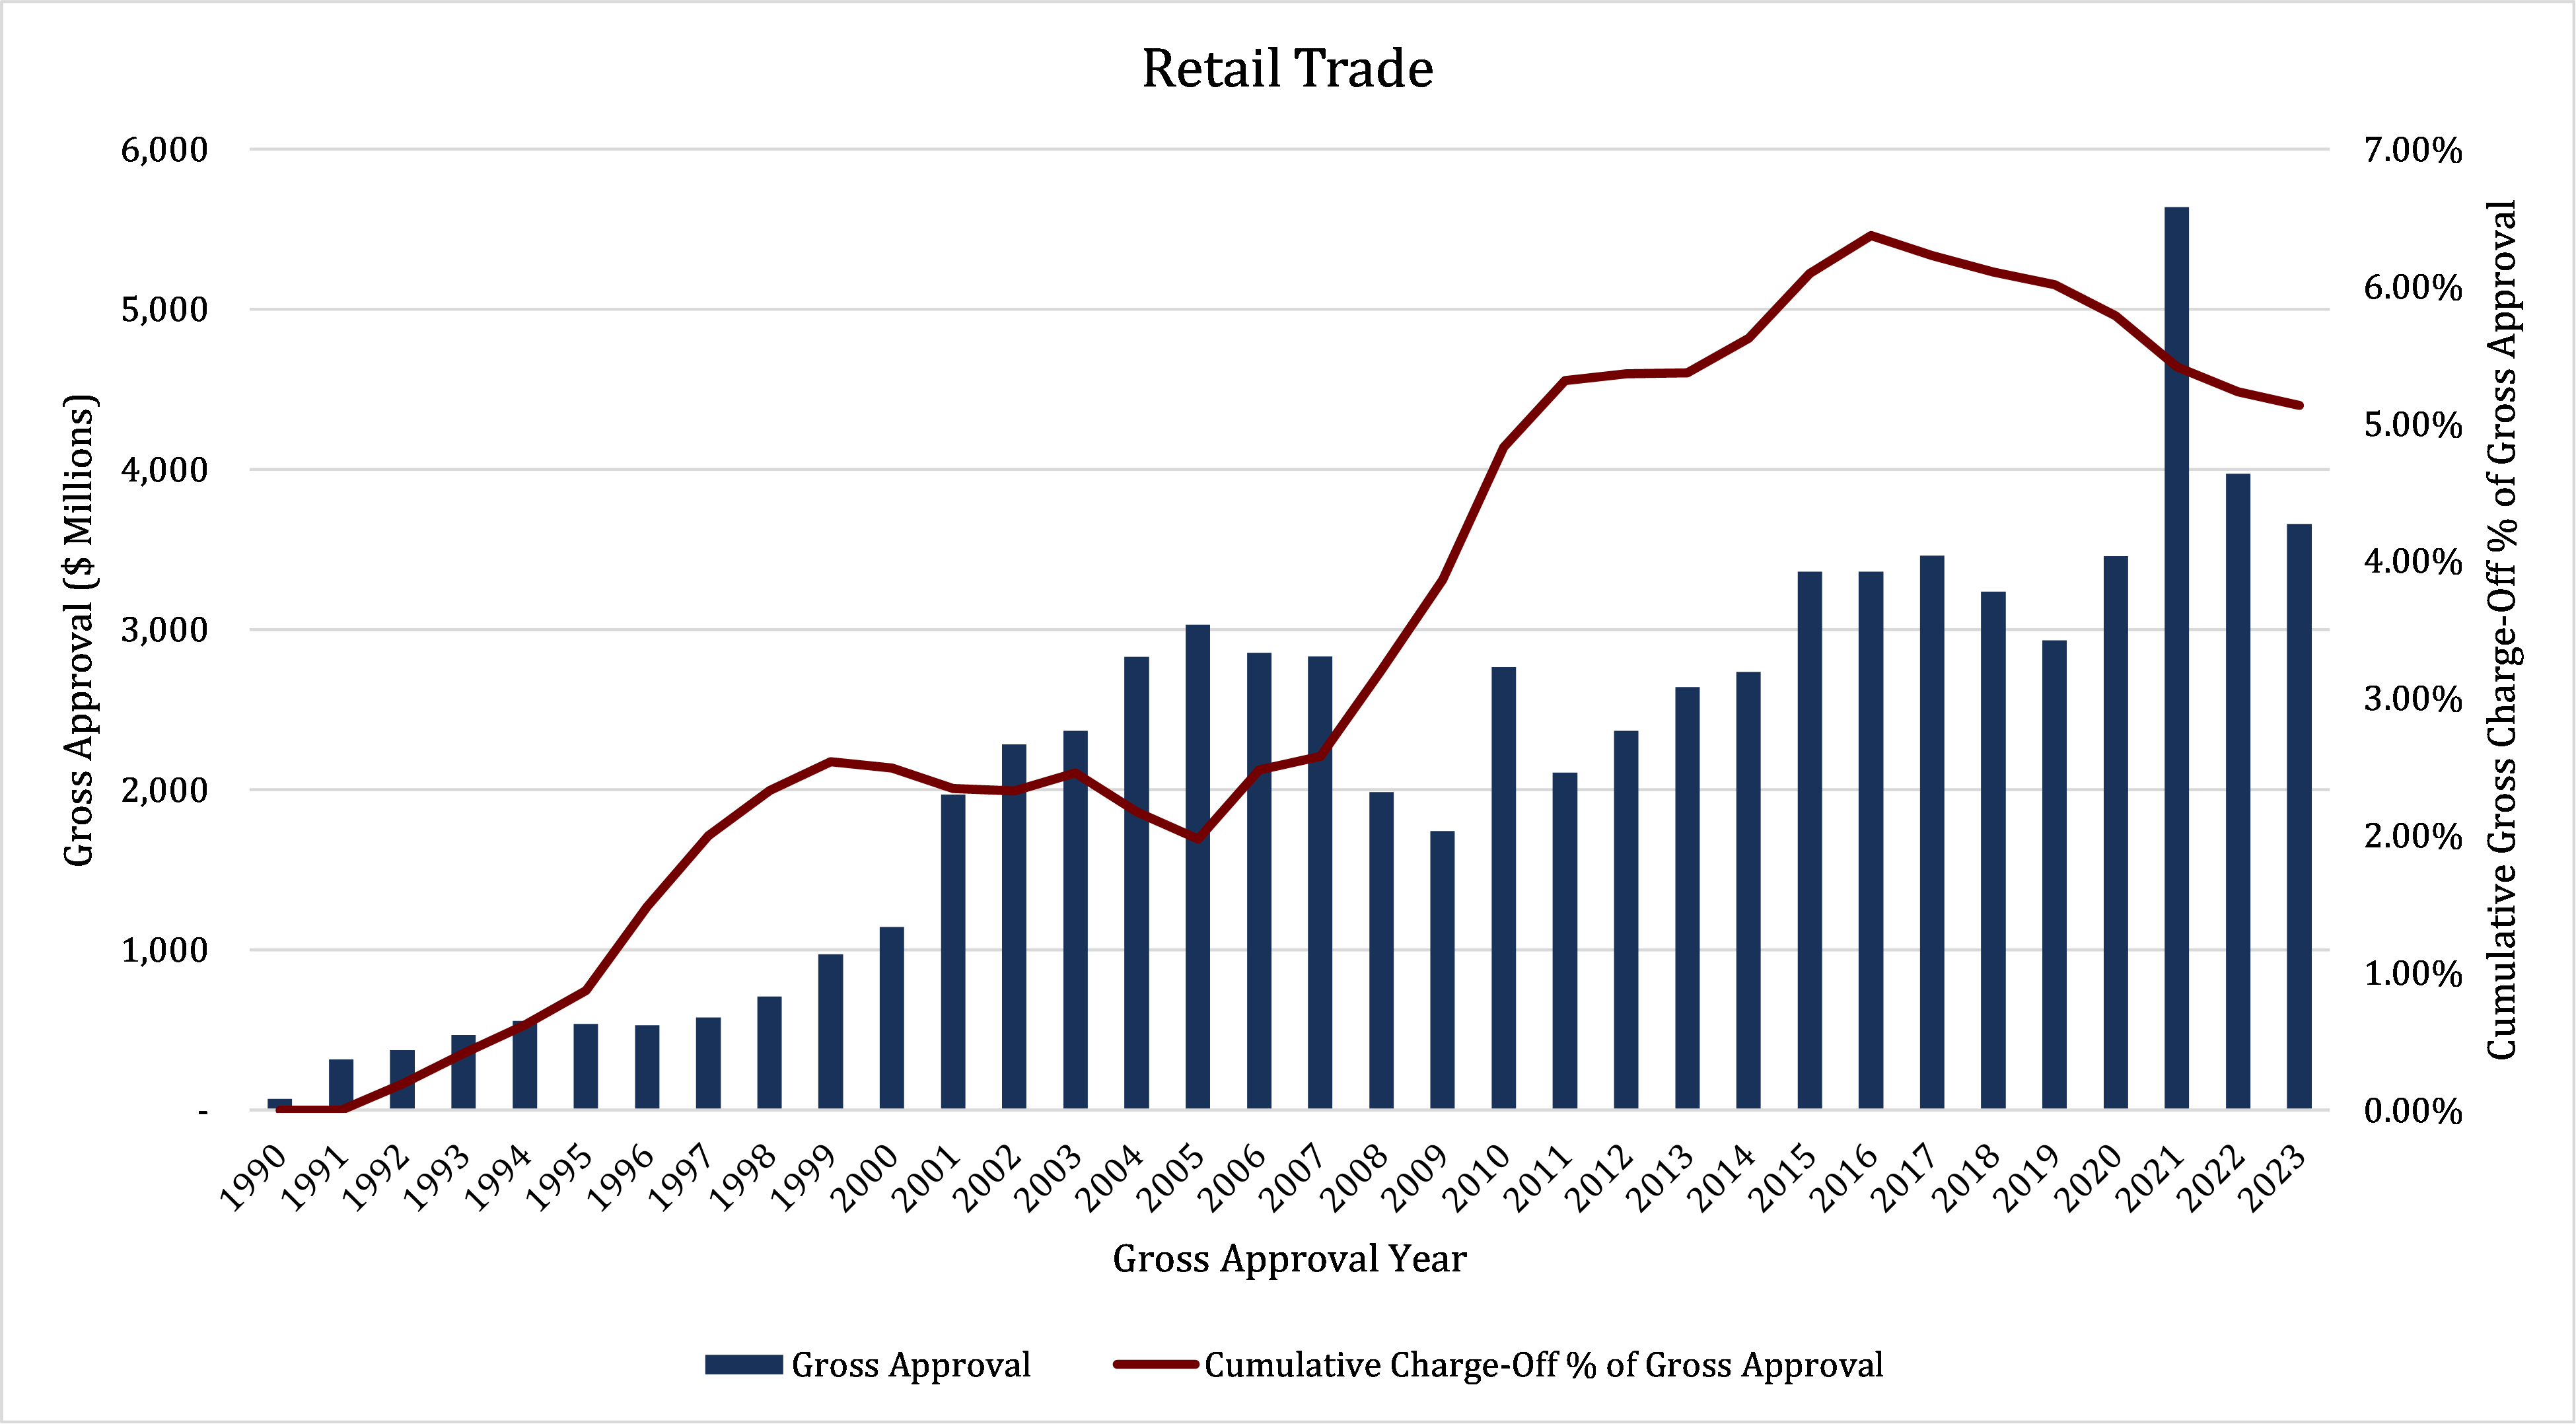
However, despite the increase in gross approvals, cumulative gross charge-off amounts increased significantly from 1.97% in 2005 to a peak of 6.37% in 2016. While charge-off levels have receded somewhat from the 2016 peak, they remain elevated even during a period of economic expansion. These trends highlight the substantial level of financial risk associated with the Retail Trade sector and signal the importance of monitoring economic indicators and market trends that can significantly influence the financial stability of retail businesses, such as unemployment levels, inflation trends, and the shift towards e-commerce.
Construction
Another sector that has exhibited adverse performance trends is the Construction sector. This sector involves entities primarily focused on building and engineering projects, including site preparation and subdivision. It encompasses new work, additions, and maintenance. The sector is managed from a fixed business location but operates on multiple sites, often under contract. It includes general contractors handling entire projects, specialty trade contractors focusing on specific tasks, and for-sale builders developing properties for sale. The sector is categorized into three subsectors: Building Construction, Heavy and Civil Engineering Construction, and Specialty Trade Contractors.
The Construction sector’s use of the SBA 7(a) loan program shows a significant growth pattern over the period shown, from $28.6 million of gross approvals in 1990 to $2.6 billion in 2023. This reflects the sector’s increasing reliance on SBA 7(a) financing. The cumulative charge-off percentages increased moderately leading up to the 2008 financial crisis, and then ramped up significantly to a peak of 6.87% in 2015. This suggests that while the Construction sector has broadly benefited from access to SBA 7(a) financing, it has not been immune to financial stress.
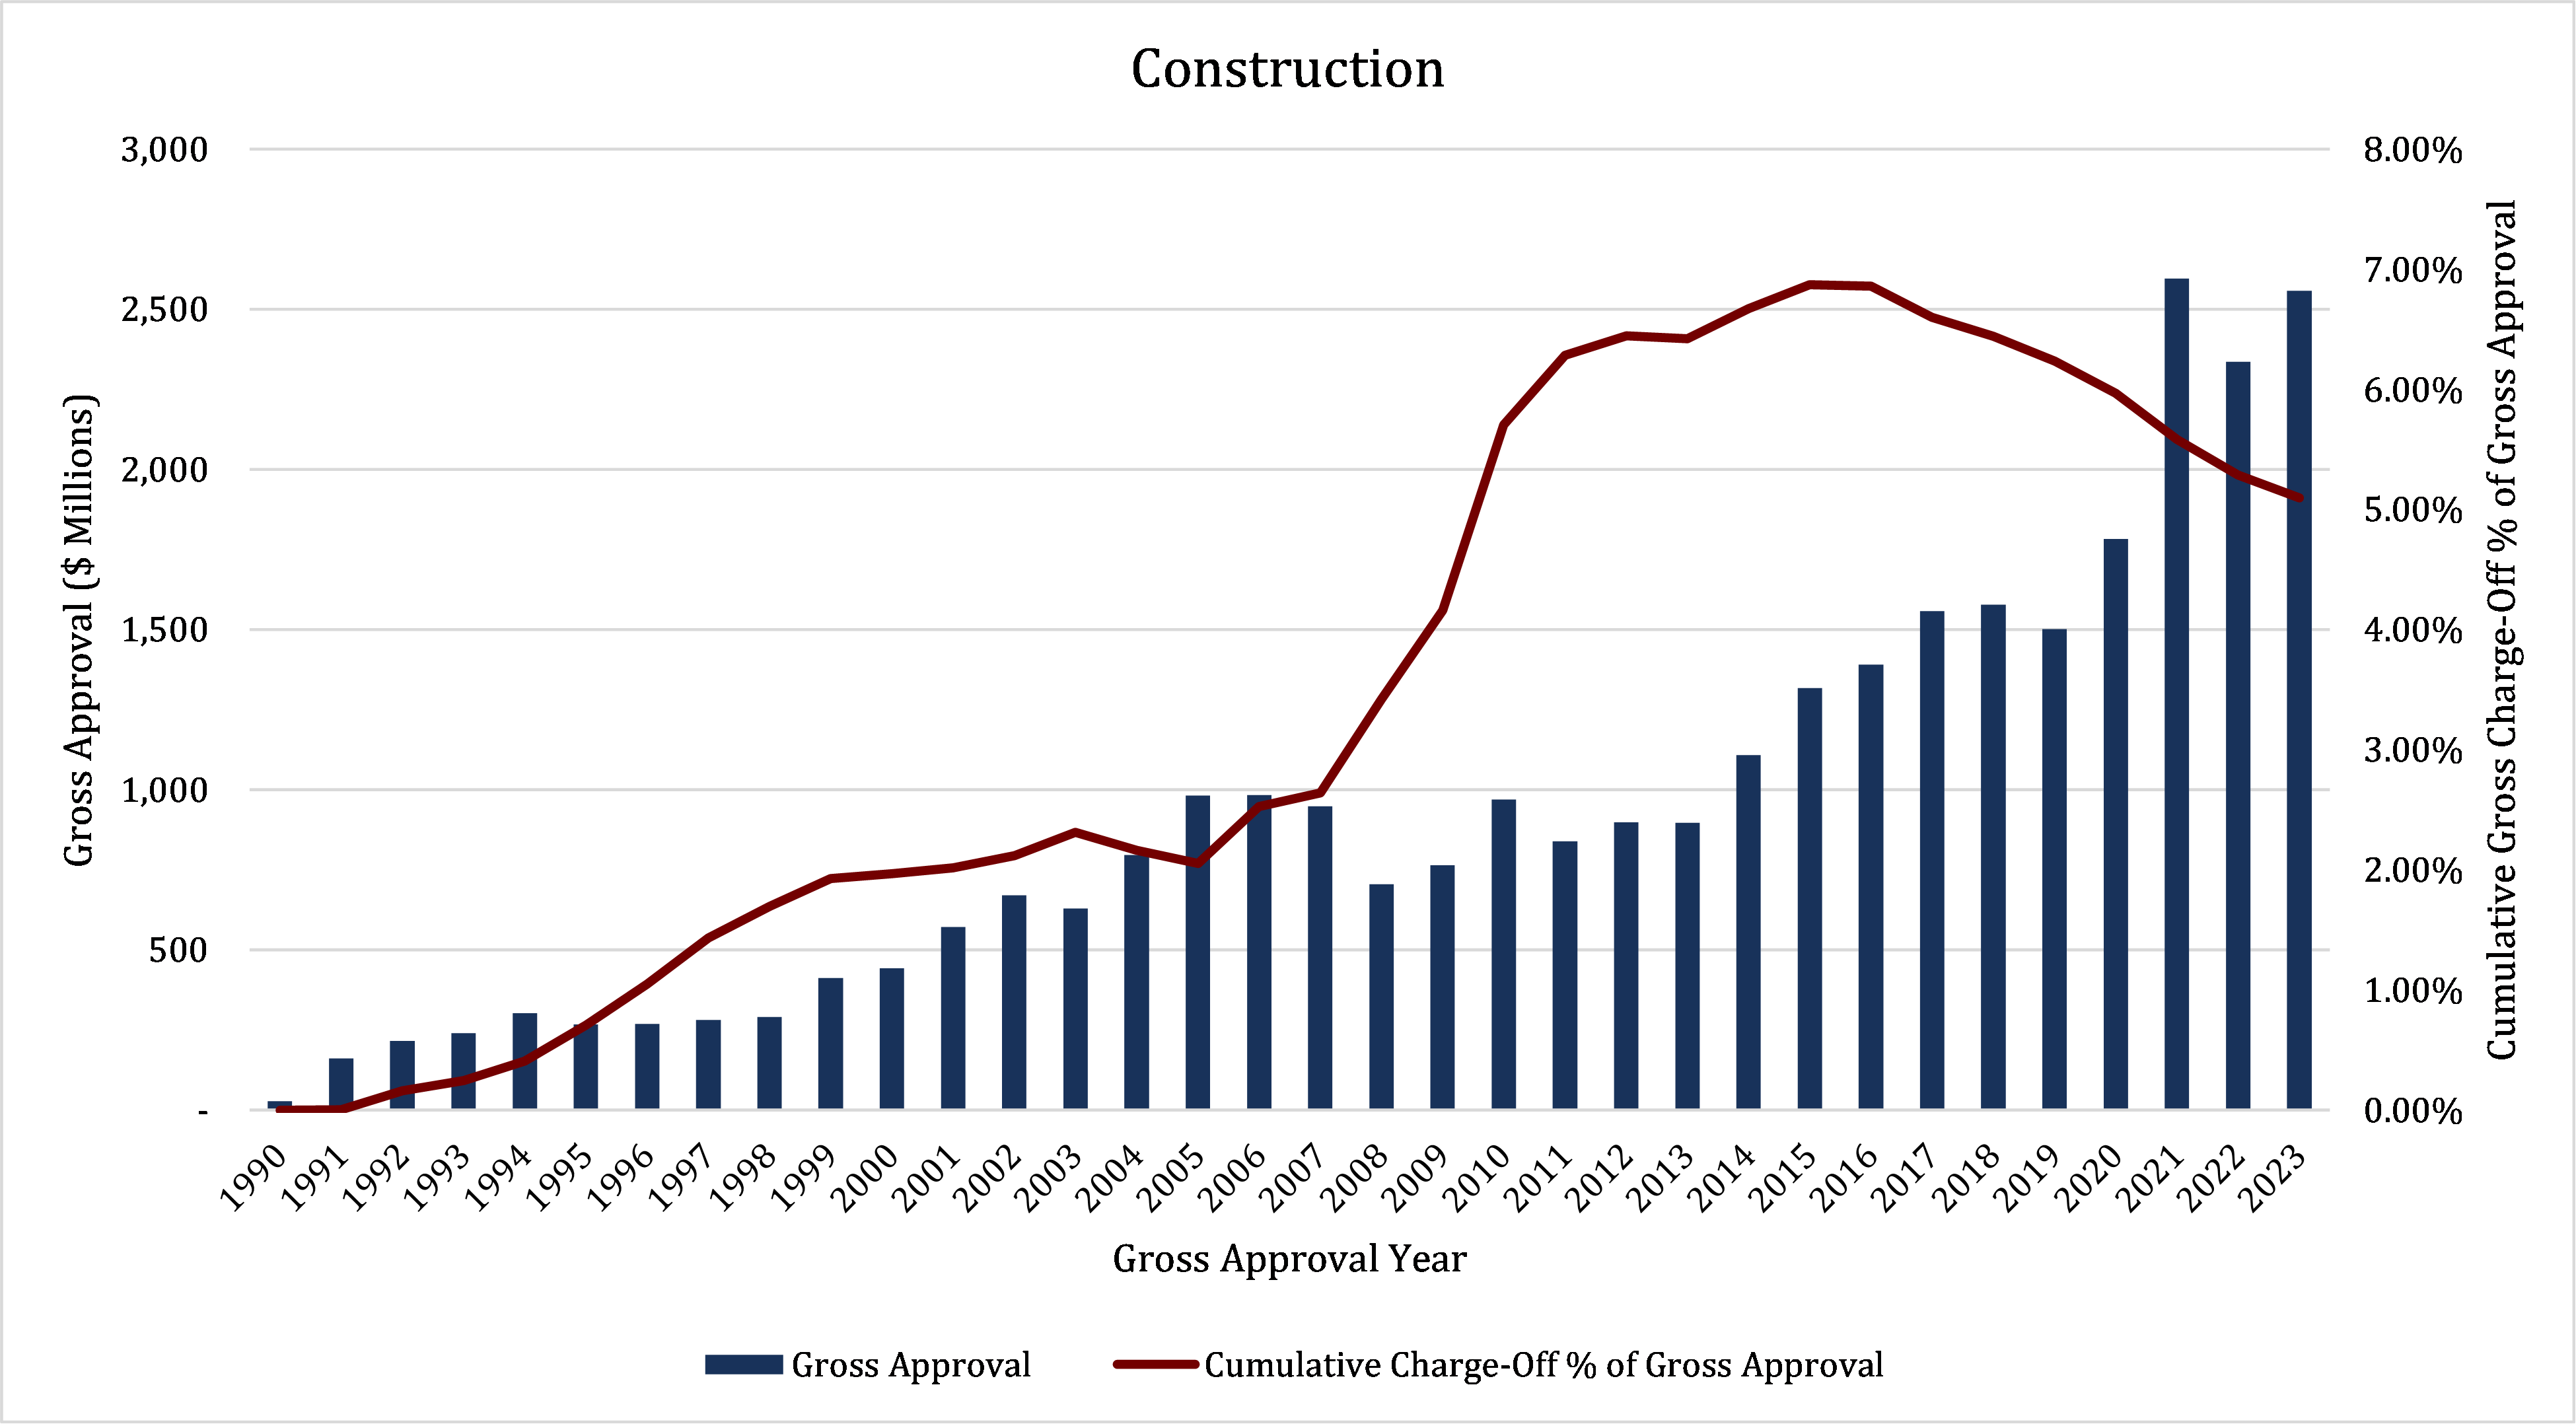
However, recent years have shown a decreasing trend in charge-off percentages, down to 5.10% in 2023, even as gross approvals have remained relatively high. This decrease indicates a positive response to the continued economic expansion, although the dollar amount of gross charge-offs remains elevated. The decreasing charge-off percentage suggests some degree of recovery; however, the cyclicality of this sector necessitates enhanced monitoring of demand for infrastructure development and, by extension, economic stability.
Information
The final sector we will examine in terms of adverse performance is the Information sector. This sector consists of establishments engaged in the following processes: producing and distributing information and cultural products, providing the means to transmit or distribute these products as well as data or communications, and processing data. The main components of this sector are motion picture and sound recording industries; publishing industries, including software publishing; broadcasting and content providers; telecommunications industries; computing infrastructure providers, data processing, web hosting, and related services; and web search portals, libraries, archives, and other information services.
Similar to the Construction sector, the Information sector’s use of the SBA 7(a) loan program shows a significant growth pattern over the period shown, from $1.3 million of gross approvals in 1990 to $328.4 million in 2021. This peak suggests a heightened investment in information-driven industries, possibly driven by the digital transformation accelerated by the COVID-19 pandemic. Post-2021, the approval amounts show a slight contraction yet remain elevated compared to earlier years, indicating continued but cautious investment.
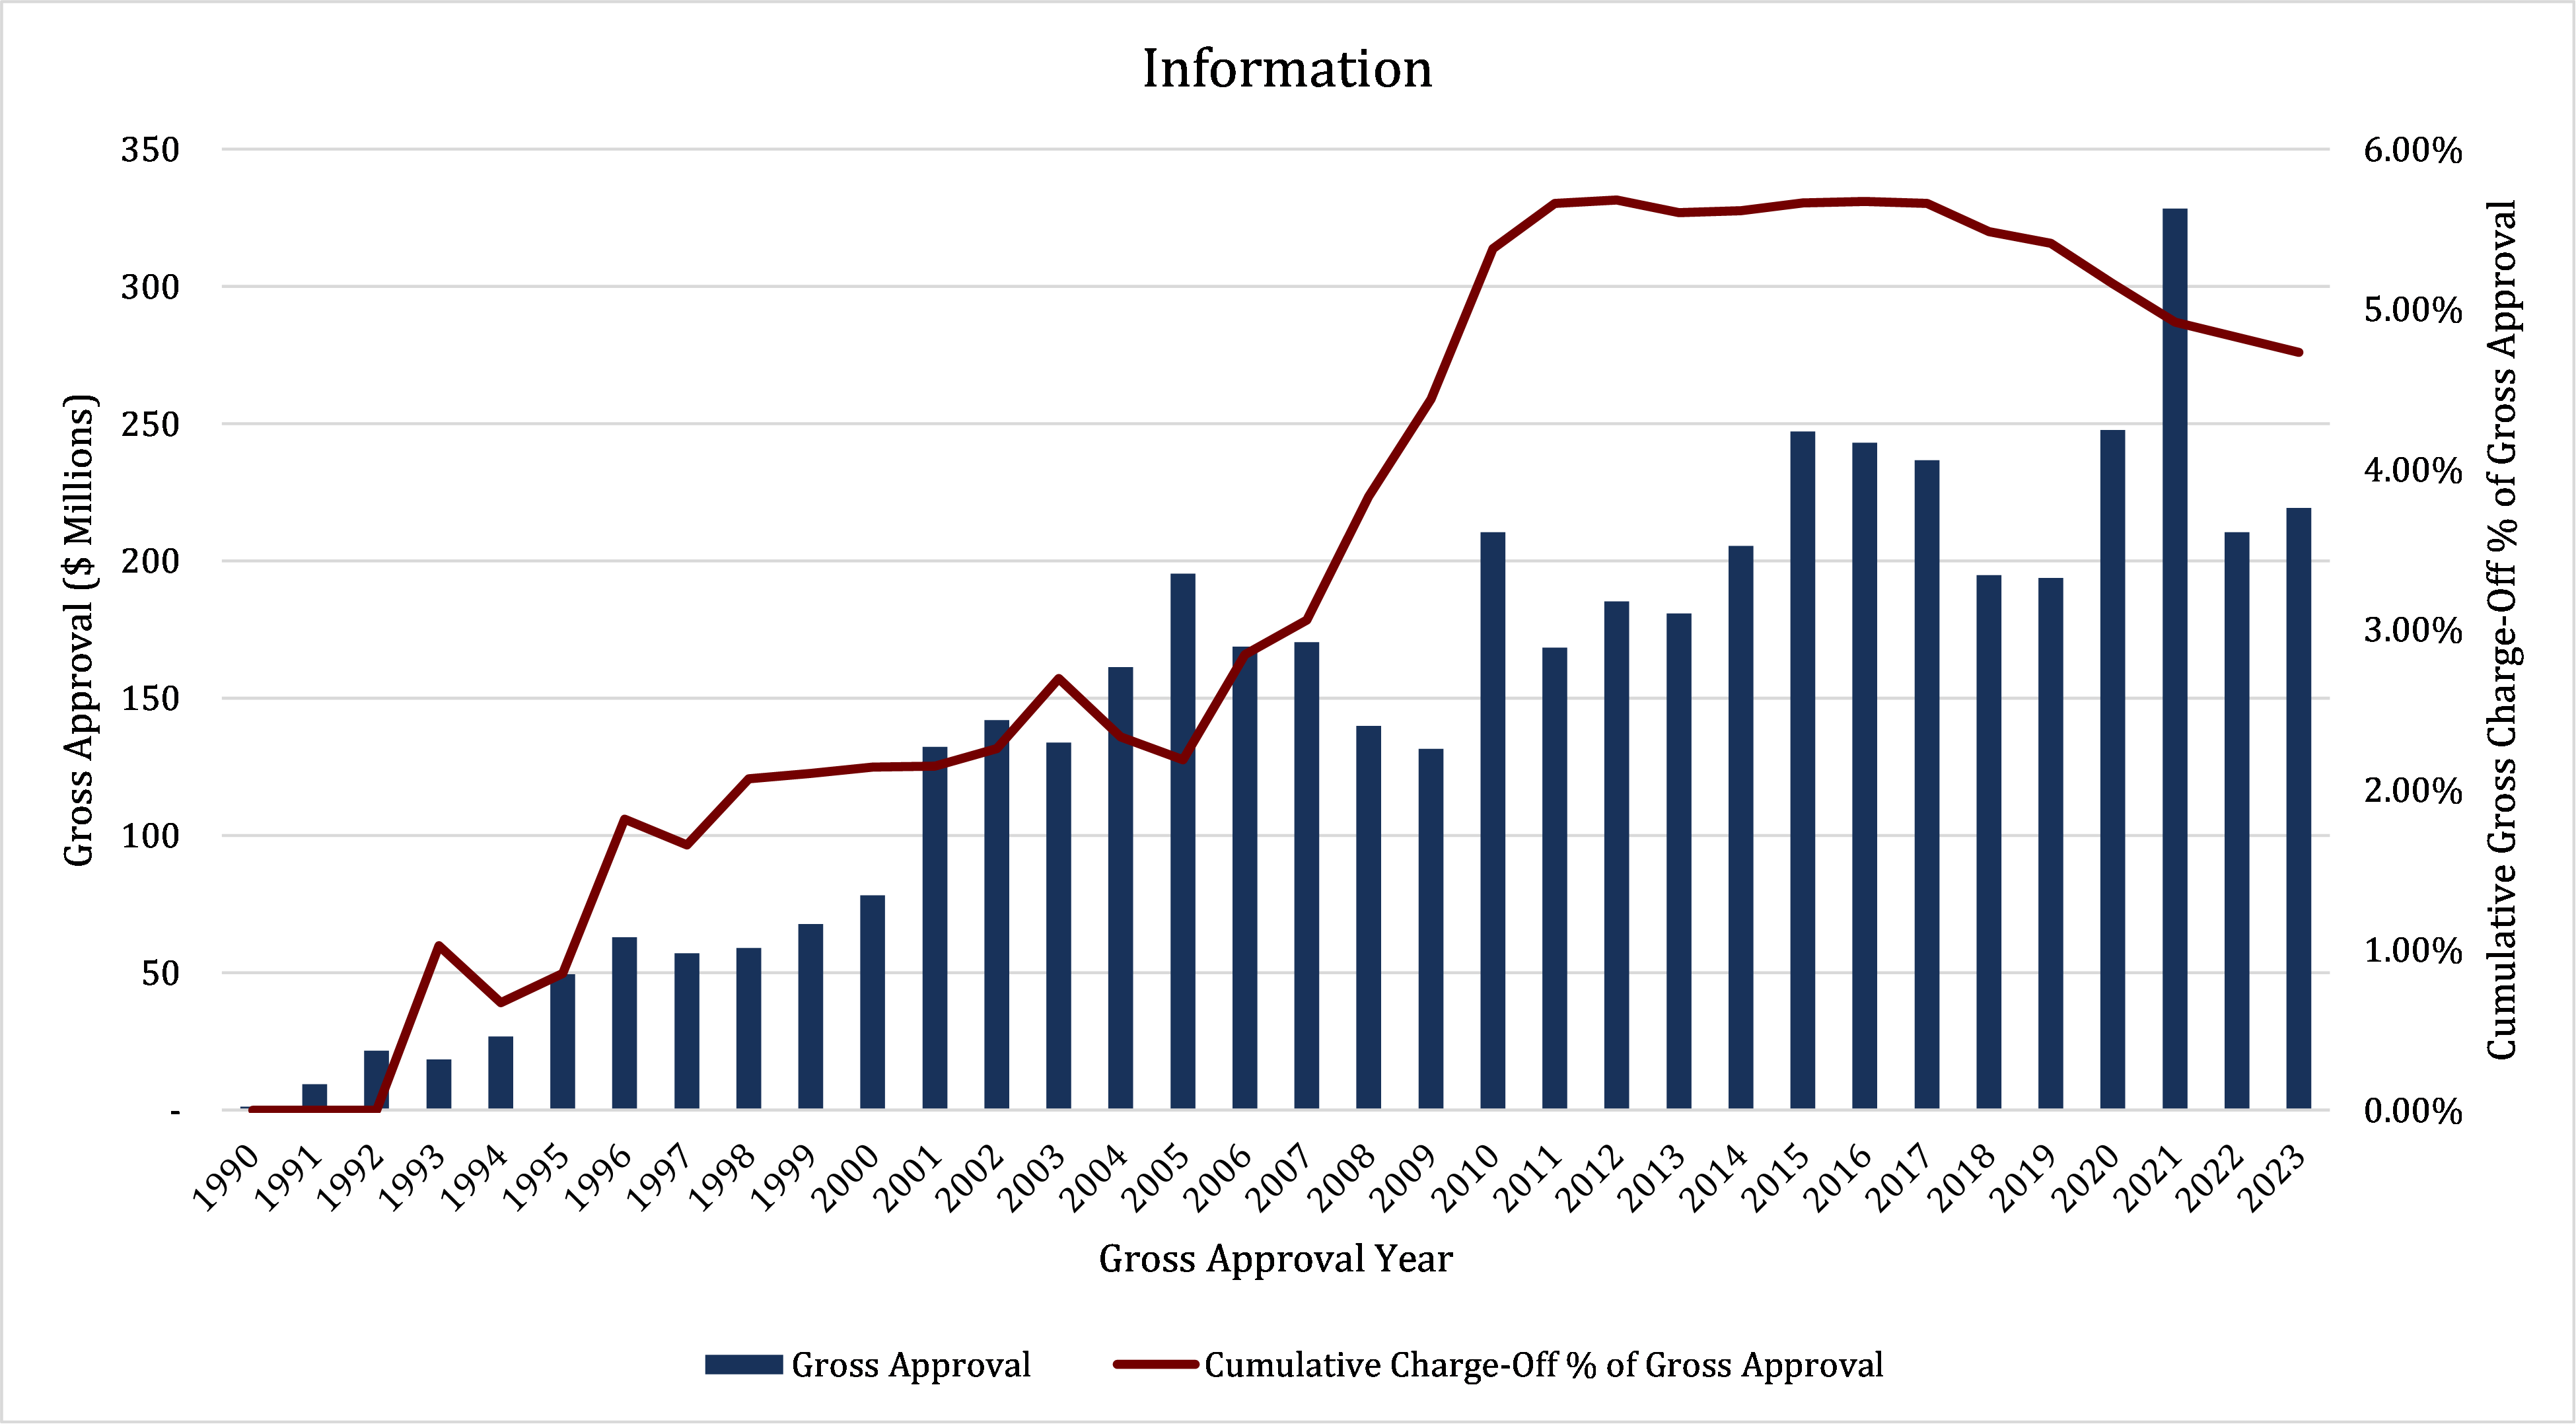
Subsequent to the 2008 financial crisis, cumulative charge-off percentages increased rapidly, from 3.83% in 2008 to 5.68% in 2012. Since then, charge-off percentages have remained elevated, declining slightly to 4.73% in 2023. The heightened charge-off percentages combined with the relatively stable level of recent gross approvals highlights broader economic shifts towards an information-centric economy; demand for financing in this sector should be viewed in the context of the broader business cycle.
Common Characteristics Among Best Performing Sectors
The three worst performing sectors under the SBA 7(a) loan program exhibit similar characteristics that contribute to their lower performance. One major commonality is their distinct sensitivity to economic cycles. Performance in these sectors is heavily influenced by consumer confidence and spending, making them vulnerable to downturns. Additionally, these sectors tend to be highly competitive with relatively low barriers to entry, which can erode profit margins. These challenges are made worse by variable demand heavily influenced by trends, consumer preferences, and discretionary incomes. These risk characteristics observed in the three worst performing sectors result in heightened charge-off rates, as evidenced by cumulative charge-off rates more than double those experienced in the best performing sectors. Understanding these risks is crucial to developing strategies to mitigate adverse outcomes when lending in these sectors.
Conclusion
We hope our comprehensive analysis of the SBA 7(a) loan program has revealed key insights into the program’s long-term performance, sector-specific dynamics, and the influence of economic environments on loan outcomes. This white paper has outlined the historical trends in loan approvals and charge-offs, highlighting how different sectors have navigated economic cycles.
Key Findings
SBA 7(a) loan performance over the last three decades is closely tied to broader economic conditions. Though exhibiting a general upward trend over time, gross approval amounts tend to slow down or decrease during recessionary periods before ramping back up again during economic expansions. Not surprisingly, charge-off trends also exhibit a sensitivity to the broader economic environment, with total charge-offs increasing during times of economic stress. Notably, during the 2008 recessionary period and ensuing recovery, charge-offs initially spiked, then recovered, then spiked again as the prolonged distress borrowers faced in differing sectors took time to result in ultimate charge-offs.
Our sector-specific analysis highlighted the contrast between the best and worst performing sectors. Sectors like Management of Companies and Enterprises, Utilities, and Finance and Insurance demonstrated resilience and stability, benefiting from providing essential services and prudent risk management. Conversely, sectors such as Retail Trade, Construction, and Information faced heightened risks, attributed to their sensitivity to economic cycles and competitive pressures.
Examining the relationship between economic cycles and loan performance underscores the cyclical nature of loan approval amounts and charge-offs. The 2008 recession, in particular, emphasizes the vulnerability of business lending to economic shocks and the prolonged impact these shocks can have on small businesses.
Significance for Community Financial Institutions
For community financial institutions, these findings underscore the importance of incorporating economic context and sector-specific insights into lending decisions. By understanding the factors that contribute to loan performance, institutions can enhance their underwriting criteria, develop more informed lending strategies, and implement proactive risk management practices. Specifically, we recommend:
- Informed Decision Making: Leveraging data-driven insights from historical loan performance and sector analyses to guide lending policies and practices.
- Proactive Risk Management: Developing risk assessment models that incorporate economic indicators and sector vulnerabilities to better anticipate and mitigate potential loan defaults.
- Enhanced Underwriting Criteria: Tailoring underwriting standards based on sector-specific risks and economic conditions, focusing on sectors with demonstrated resilience and strategic importance to the economy.
In conclusion, the SBA 7(a) loan program plays an important role in supporting small businesses, with its success linked to the economic landscape and sector-specific factors. By applying the insights gained from this analysis, community financial institutions can better support small businesses through informed lending practices that promote financial stability and growth.
References
- Business Cycle Dating, National Bureau of Economic Research, www.nber.org/research/business-cycle-dating.
- “North American Industry Classification System – NAICS.” North American Industry Classification System, United States Census Bureau, www.census.gov/naics/?58967%3Fyearbck=2022.
- “7(a) & 504 FOIA – U.S. Small Business Administration (SBA): Open Data.” U.S. Small Business Administration (SBA) | Open Data, U.S. Small Business Administration Office of Capital Access, 5 Feb. 2024, data.sba.gov/dataset/7-a-504-foia.