Mortgage Servicing Rights Valuation – Input Assumption & Shocks [White Paper]
Key Takeaway
Wilary Winn provides valuations of mortgage servicing rights and turnkey advice on how to properly account for them.
How Can We Help You?
Founded in 2003, Wilary Winn LLC and its sister company, Wilary Winn Risk Management LLC, provide independent, objective, fee-based advice to over 600 financial institutions located across the country. We provide services for CECL, ALM, Mergers & Acquisitions, Valuation of Loan Servicing and more.
Released April 2023
Introduction
This white paper is intended to provide insight into the valuation of mortgage servicing rights (“MSR”) and the key assumptions used to value them. We also show the relative effect each key assumption has on the overall value by providing sensitivity analyses for each individual assumption.
A mortgage servicing right is the right to service a loan on behalf of an investor and collect a servicing fee. Loan servicing consists of collecting and processing loan payments throughout the life of a loan. Servicing activities also include billing the borrower; collecting principal and interest payments as well as taxes and insurance payments; disbursing property taxes and insurance premiums; accounting for these activities at the loan and investor level; and forwarding funds to an investor in the secondary market. MSRs are a modified interest-only strip. The expected life of the loan is calculated based on its expected prepayment rate and is a key valuation variable.
Major Valuation Components
Servicing Fee
The servicing fee is paid monthly based on the outstanding principal balance of the loan. Servicing fees vary by type of investor. Standard fees are 25 basis points for fixed rate conventional (Fannie Mae/Freddie Mac) loans, 37.5 for conventional ARM loans, 44 basis points for Ginnie Mae I loans, and between 19 and 56.5 basis points for Ginnie Mae II loans.
Ancillary Income
Ancillary income includes late fees, insurance income and other fees earned from soliciting the portfolio. It varies by an institution’s ability to cross-sell its mortgagors. Wilary Winn’s ancillary income assumption is based primarily on forecasted late fees, which are in turn based on the payment amount. The payment amount in turn is based on loan size and the loan’s interest rate.
There are a number of firms that survey the marketplace quarterly to obtain information regarding servicing input assumptions. The two most recent surveys we obtained were performed in Q4 2022 and are the surveys that will be referenced throughout this white paper. Wilary Winn benchmarks our ancillary input assumption, as well as other input assumptions to the surveys. We also benchmark our assumptions to the work of other valuation firms obtained through our work as auditor-engaged specialists as described in “AS 1210” of the PCOAB auditing standards. We detail our comparisons by input assumption later in this white paper.
Servicing Costs
Servicing costs are best expressed in dollars per loan per year, as they are more closely related to units versus loan size. Valuations based on servicing costs expressed in basis points imply that the cost to service a $300,000 loan is three times that of a $100,000 loan, which is decidedly untrue. The input assumption should consider current and future base costs. Our future costs are based on the long-term forecasted rate of inflation as of the valuation date.
The base servicing cost input assumption is generally based on the marketplace’s assumption of the marginal cost to service a loan. The assumption varies slightly by investor. For example, according to the assumption surveys, the median base cost to service a current conforming conventional loan is $64.45 in the first survey and $72.50 in the second survey, while the assumption for a GNMA FHA loan is $75.00 in the first survey and $85.00 in the second survey.
Delinquency Rate and Foreclosure Losses
The existing and projected delinquency rate of the portfolio can be an important assumption. A valuation should include the projected incremental costs to service delinquent loans. The valuation should also include foreclosure losses which vary by type of investor. For example, a foreclosure on an FHA-insured loan could result in a loss from costs denied by the FHA as well as interest lost from servicing advances. We note that the servicer is required to advance at the note rate while the FHA reimburses the servicer at the FHA debenture rate, which is nearly always lower than the note rate.
Some of the programs offered by the FHLBanks include sales with limited recourse. The servicing valuation should consider the credit risk arising from such sales, as appropriate.
Wilary Winn derives our delinquency assumptions from information provided by the Mortgage Bankers Association, which is released quarterly. We benchmark our cost assumptions to information contained in the MSR assumption surveys and to inputs used by other valuation firms.
Float Earnings
Interest income from float arises from two sources. The larger component comes from loans that are escrowed (impounded) for property taxes and hazard insurance. The servicer collects the escrow payment monthly, disburses the insurance annually, and disburses the property taxes quarterly, semi-annually, or annually depending on the jurisdiction. A minor source of float comes from the principal and interest payments. Most payments come in before or near the first-of-the-month due date. Under certain investor programs, the servicer remits these payments later. For example, a servicer remits the actual principal it has received along with the interest it was scheduled to receive to Freddie Mac on the 18th of the month under Freddie Mac’s standard remittance methodology. This remittance method is called scheduled/actual. Another common remittance methodology, especially for Fannie Mae loans, is actual/actual where the servicers remit only the funds it has received. Servicers are required to remit scheduled principal and interest to holders of Ginnie Mae MBS.
Some jurisdictions require servicers to pay interest on the mortgagor’s escrow account, resulting in less benefit or, in some cases, at a detriment. For example, the state of California requires servicers to pay the mortgagor 2 percent on escrow accounts.
Expected Loan Life – Prepayments
The expected life of a loan is based on the attributes of the loan, including term and expected prepayments. Wilary Winn models at the loan level and we derive expected cash flows by adjusting the contractual cash flows for:
- Voluntary prepayments – the conditional repayment rate (“CRR”)
- Involuntary prepayments – the conditional default rate (“CDR”)
- Loss severity or loss given default – the loss that will be incurred on a default which is generally relatively small because the loans are sold without recourse or with limited recourse
The expected loan life is derived from the resulting expected cash flows. The prepayment assumption is the most sensitive input in the model and varies greatly. The secondary market for mortgage loans is enormous and, as a result, there are several prepayment models available in the marketplace. Wilary Winn utilizes the MIAC model which is based on the major mortgage-backed securities (“MBS”) dealers’ forecasts for prepayments of MBS. We also benchmark the MIAC prepayment model to forecasted prepayments of MBS securities reported by Bloomberg. Prepayments are primarily driven by changes in market interest rates. Other factors affecting prepayments are the original term, the remaining term, the type of mortgage-backed security (FNMA/FHLMC vs. GNMA), and, in some cases, the balance of the loan. (The incentive to refinance a loan with a small balance is less as the interest savings might not be significant relative to the costs of refinancing.) As a result, the MIAC inputs in 2023 are quite granular with 71 tranches for conventional 30-year loans and 32 tranches for conventional 15-year loans. See the attached Appendix A for a sampling of the MIAC prepayment speeds as of April 3, 2023.
Because the MIAC forecast is based on MBS and not the interest rate on the loan, we need to map the loan to the appropriate MBS. The note rate is higher because it includes the servicing fee and the guarantee fee paid to the guarantor – e.g., Freddie Mac, Fannie Mae, Ginnie Mae.
Wilary Winn has reviewed FNMA and FHLMC securitization data from Bloomberg and compared the weighted average coupon (“WAC”) to the MBS security rate to calculate the spread between mortgage interest rates and MBS security rates. For FNMA and FHLMC 30-year and 15-year loans, we calculated the weighted average spreads for 2019 – 2022 MBS securities and the results were as follows.

Based on the above analysis, Wilary Winn lowers the interest rate of a 30-year loan by 0.875% and a 15-year loan lower by 0.625% to estimate the appropriate MBS coupon to use when applying a prepayment speed, e.g., a 30-year loan with a 3.875% interest rate equates to a 3.000% MBS.
Discount Rate
The final key element in valuing the MSR is the interest rate used to discount the future cash flows to present value. Wilary Winn uses a build-up method to derive the discount rate. We begin with the average of the 5-year and 10-year Treasury rates and add a spread for prepayment and default risk. As of December 31, 2022, we added 5.5 percent to the underlying risk-free rate. The discount rate is the least transparent input because the parties to bulk servicing trades are bound by confidentiality. Therefore, we benchmark our discount rate to the MSR surveys and to the rates we see used by other valuation firms.
As an additional step, we calculate the IRR of flow servicing released premiums. Purchasers of flow servicing will often underprice the value of the loan while overpricing the value of the servicing in their rate sheets. Due to this, Wilary Winn has performed an analysis to calculate the implied servicing value that the purchasers are paying for servicing. We have done this by comparing the all-in price (loan price plus service released premium) to a Freddie Mac loan price using five different institutions that purchase loans on a flow basis. The sample loan we used in this analysis was a $275,000 30-year fixed rate conventional loan with a 6.375% interest rate. Once we calculated the implied servicing values, we used our servicing model to solve for the required yield to obtain the implied servicing price. Below are the results of this analysis.
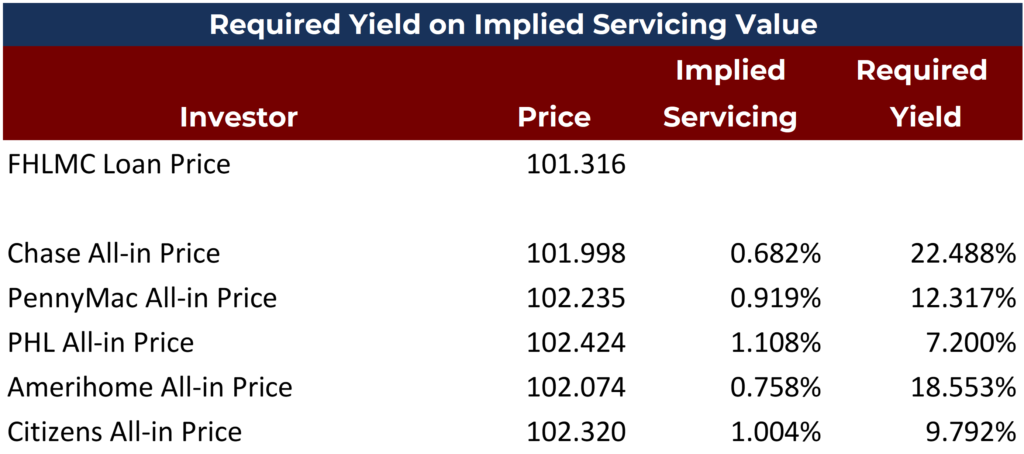
We note that each purchaser will have a different opinion regarding prepayment speeds, servicing cost, ancillary income, etc. Additionally, each purchaser will have a different appetite for certain types of loans at different times (30-year vs. 15-year, conventional vs. government, etc.) and they may price aggressively or conservatively based on the types of loans they would like to acquire at any given time. We note that these yields are very wide and indicate that Chase, Amerihome, and, to a lesser extent, PennyMac are bidding very conservatively, while Citizens and PHL are pricing more aggressively. The median and average discount rates in the MSR assumption surveys for conforming conventional loans are 9.38% and 9.49%, respectively, in the first survey and 10.75% and 10.19%, respectively, in the second survey, which lie in the middle of these implied servicing yields.
Sensitivity Analysis
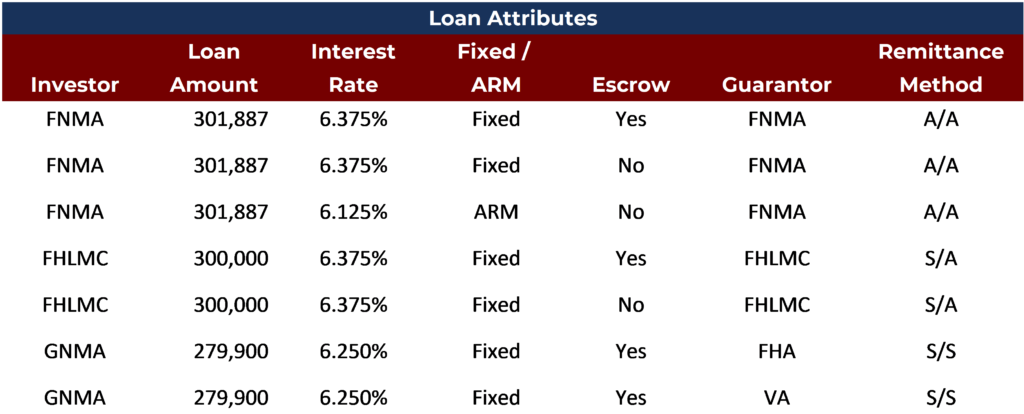
Certain input assumptions have a larger effect on MSR values than other assumptions. To show the relative effects of changes to the input assumptions on the overall MSR value, we have modeled seven different hypothetical loans. In each case, we are using an estimated market note rate for a 30-year loan as of March 31, 2023. We are using 30-year loans because they have the longest duration and will therefore show the largest change in value. We have included the most significant secondary market outlets to account for differences in remittance methods. We have also included a Fannie Mae and a Freddie Mac loan with escrows and another that is non-escrowed for taxes and insurance. We note our Ginnie Mae examples are based on an FHA-insured loan and a VA guaranteed loan. We have also included a Fannie Mae adjustable-rate mortgage (“ARM”). We note that we are assuming the loans are located in Minnesota, which affects our delinquency and float input assumptions.
Prepayment Speed Assumption for Sensitivity Analyses
Our assumption for prepayment speed is 12.218% for the Fannie Mae and Freddie Mac fixed rate loans, 21.152% for the Fannie Mae ARM loan, 17.660% for the Ginnie Mae FHA fixed rate loan, and 17.717% for the Ginnie Mae VA loan.
We hold these speeds constant for the input assumption shocks that follow. We show the prepayment shocks as the final input assumption in the Prepayment Shock Analyses section below.
Average Loan Size and Servicing Income
The loan sizes for Fannie Mae and Freddie Mac are based on their December 31, 2022, 10-K filings. The average loan size for Ginnie Mae originations is per Ginnie Mae’s Global Markets Analysis Report, March 2023, page 27.
The servicing fee is 25 basis points for Fannie Mae and Freddie Mac fixed rate loans, 37.5 basis points for the Fannie Mae ARM, and 44 basis points for the Ginnie Mae Loans.
The following chart shows the change in the servicing value if we reduce the loan size by 20%.
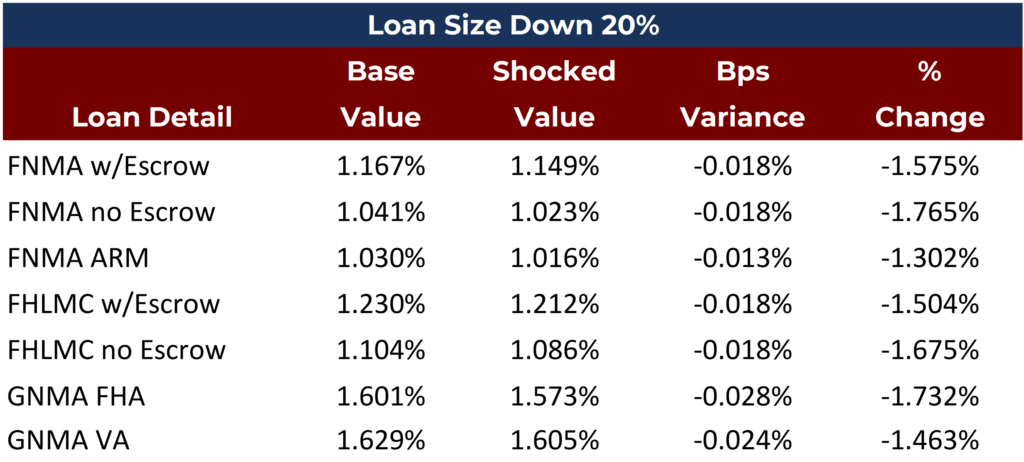
As one can see, a relatively large change in the size of the loan has a relatively modest effect on the overall MSR value.
Ancillary Income
Our ancillary income assumptions for these sample loans are $30 per loan per year for the FNMA and FHLMC loans and $40 per loan per year for the GNMA loans. The chart below details the change in the servicing value if we reduce the ancillary income assumption by 20%.
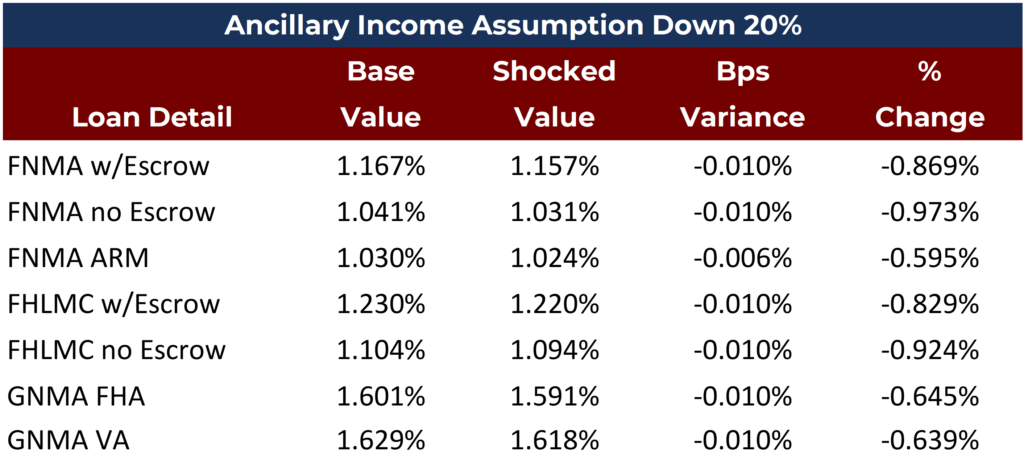
The results show that a relatively large change in the ancillary input assumption has a relatively modest effect on the overall MSR value. To put this in additional context, according to the MSR surveys, the median annual ancillary income for a conforming conventional loan is $25.50 in the first survey and $34.00 in the second survey. The income input assumption at the 25th percentile of the first survey is $19.20, which is a difference of $6.30 or 24.7%. Our base ancillary income assumption for FNMA / FHLMC loans is $30 per year and our 20% decrease for the shock is $24 which is a difference of $6 per year. Our base ancillary income assumption for GNMA loans is $40 per year and our 20% decrease for the shock is $32, which is a difference of $8 per year. This shows that our decrease in ancillary income is relatively consistent with the range of market ancillary income assumptions.
Servicing Costs
Our base servicing cost assumptions are $70 per loan per year for the Fannie Mae and Freddie Mac fixed rate loans, $75 per loan per year for the Fannie Mae ARM loan, and $80 per loan per year for the Ginnie Mae loans. The chart below details the change in the servicing value if we increase the servicing cost assumption by 20%.
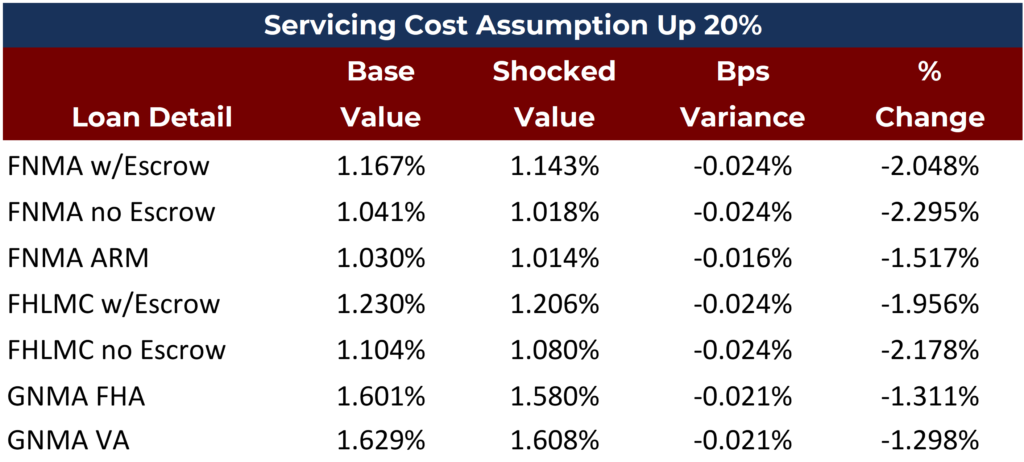
As detailed above, a relatively large change in the servicing cost input assumption has a relatively modest effect on the overall MSR value.
To put this in additional context, according to the MSR surveys, the median annual cost to service a current conforming conventional loan is $64.45 in the first survey and $72.50 in the second survey. The cost input assumption at the 75th percentile in the first survey is $67.75. Our base cost estimate is $70.00 and our 20% shock input assumption is $84.00, which is over four times the dollar size increase in moving from the median to the 75th percentile. This shows that our 20% increase in cost is a relatively large increase compared with the range of market cost input assumptions.
Foreclosure Rate
Our foreclosure rate assumptions for the loans are shown below based on the MBA delinquency study as of December 31, 2022, for loans located in Minnesota.
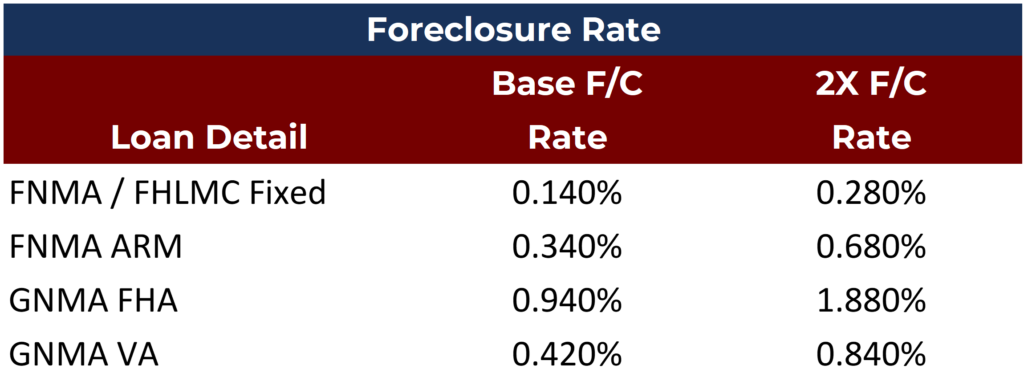
The chart below details the change in the servicing value resulting from a doubling of the foreclosure rate assumption.
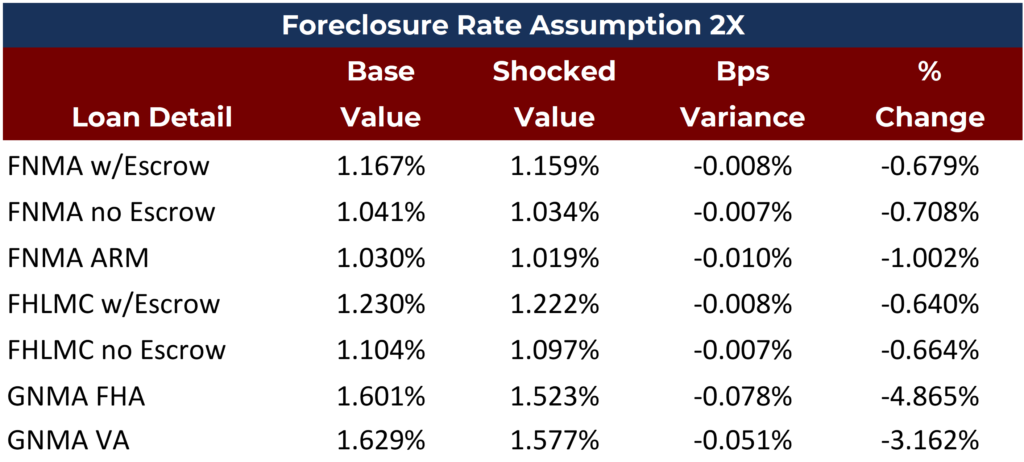
The foreclosure rate assumption affects the GNMA loans the most because the base foreclosure rate is higher, but also because the required remittance method is scheduled principal and scheduled interest, meaning that the servicer must advance funds to the investor regardless of whether the borrower makes their payment. In addition, a loss on foreclosure is larger for GNMA loans based on how the guarantor, the FHA or VA reimburses the servicer.
Loss on Foreclosure
Our one-time foreclosure cost assumptions are $1,400 for the Fannie Mae and Freddie Mac loans, $4,500 for the FHA-insured Ginnie Mae loan, and $7,500 for the VA-guaranteed Ginnie Mae loan. Below, please find a chart detailing the change in the servicing value if we increase the foreclosure cost assumption by 20%.
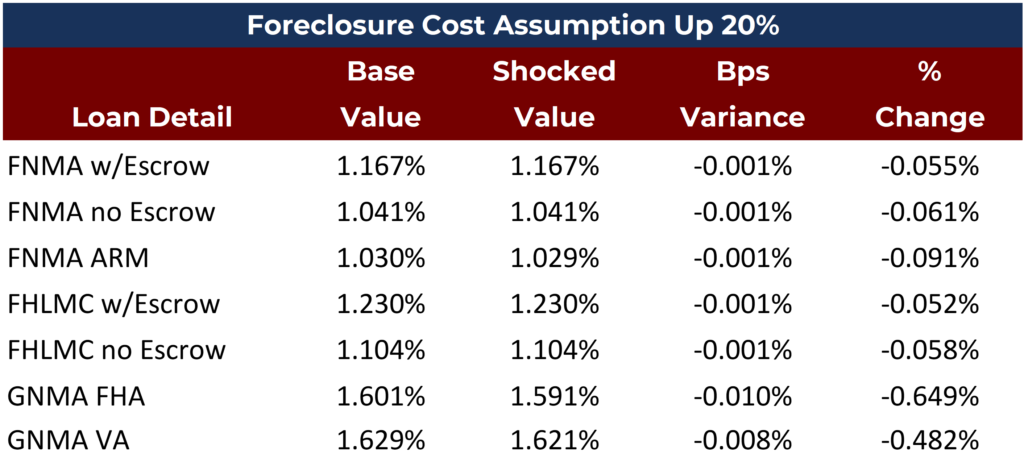
Not surprisingly, the largest effect is on the GNMA loans given that our base input loss and cost assumptions are both higher than the assumptions for conforming conventional loans. To put this in additional context, according to a Q3 2022 MSR assumption survey (the most recent survey we have with VA foreclosure cost assumptions included), the median cost of a foreclosure on a VA loan is $7,065. The input assumption at the 75th percentile is $8,415. Our input was $7,500, which we increased to $9,000 in our shock. This shows that our 20% increase in cost is slightly higher, but relatively inline compared with the range of market cost input assumptions.
According to a Q3 2020 MSR survey (the most recent survey we have with FHA foreclosure cost assumptions included), the median cost of a foreclosure on an FHA-insured loan is $4,300. The input assumption at the 75th percentile is $5,312. Our input was $4,500, which we increased to $5,400 in our shock. This shows that our 20% increase in cost is relatively inline compared with the range of market cost input assumptions.
Finally, we note that based on the modest rates of delinquency for loans located in Minnesota, the change in the foreclosure loss input assumption does not significantly affect the overall MSR value. At December 31, 2022, the Minnesota delinquency rates were approximately 73% of the national average delinquency rates for fixed rate conventional loans.
Float Earnings
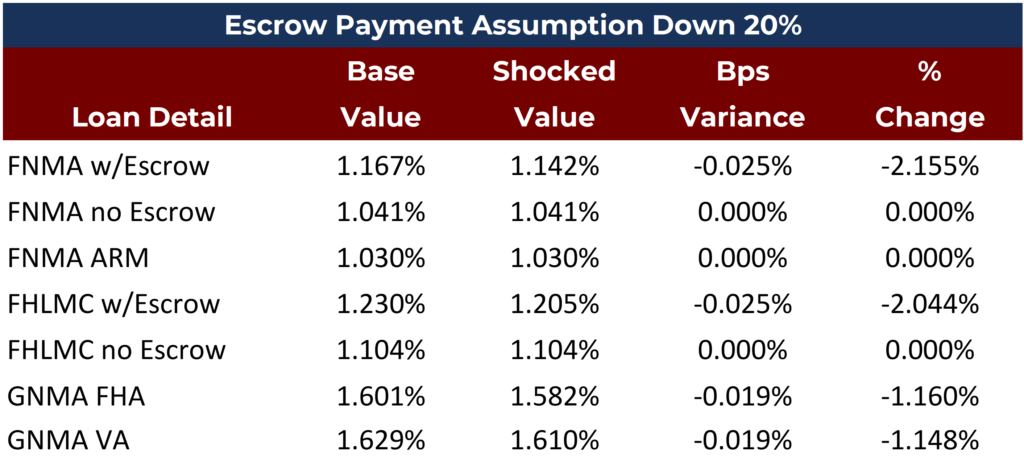
Our assumption for the T & I payment is $622 for the Fannie Mae escrowed loan, $618 for the Freddie Mac escrowed loan, and $569 for the FHA and VA loans. We are assuming the loans are located in Minnesota. The tax payments are therefore due semi-annually and there is no requirement to pay the borrower any interest on their escrow balance. Below, please find a chart detailing the change in the servicing value if we reduce the escrow payment by 20%.
Wilary Winn uses the SOFR forward curve to forecast the interest rate earned on float arising from the P&I payments and escrow payments. With interest rates having risen substantially in 2022 to be more in line with historical norms, the impact of float on the value of MSRs has increased since December 31, 2021. The chart below shows the effect of increasing the SOFR forward curve by 2 percent.
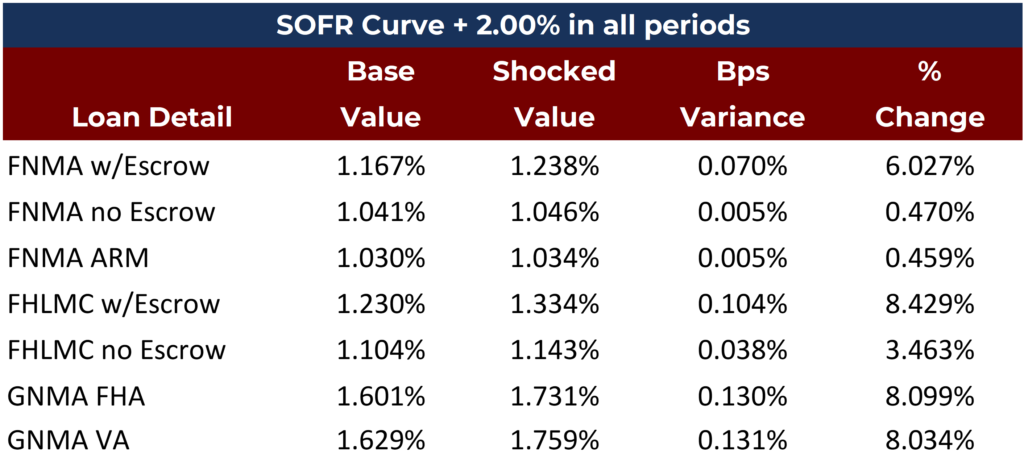
This change has a relatively large effect on the overall value of the MSR asset for loans that escrow and a much more modest impact for loans that do not escrow. Although SOFR is not perfectly correlated with treasury and mortgage rates, it would be expected that other interest rates would show an increase similar to what we’ve incorporated in this shock scenario.
Discount Rate
Our discount rate assumptions at March 31, 2023, are 9.00% for the Fannie Mae and Freddie Mac fixed-rate loans, 11.00% for the Fannie Mae ARM loan, and 10.50% for the Ginnie Mae loans. The chart below details the change in the servicing value if we increase the discount rate assumption by 20%.
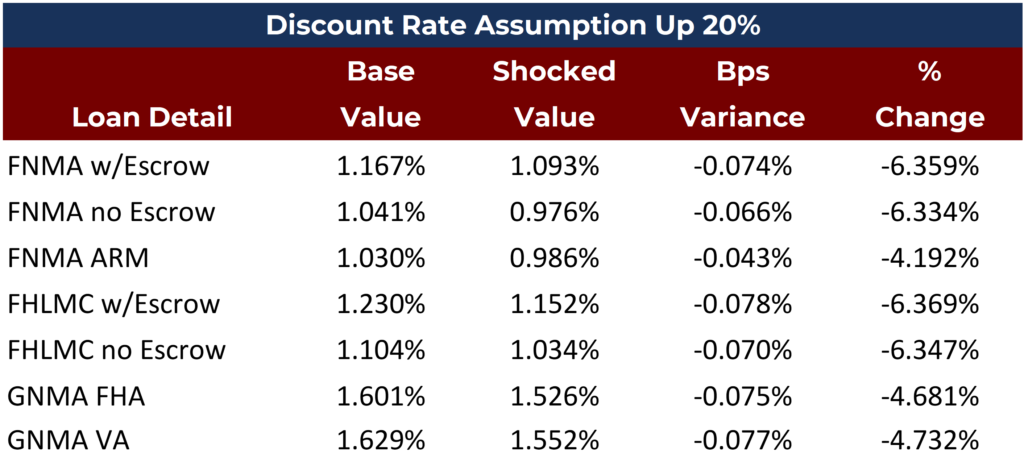
The results show that the discount rate used has a significant effect on the overall value of the MSR asset. To put this in additional context, according to the MSR surveys, the median discount rate (for firms using a static rate vs. OAS) is 9.40% in the first survey and 10.75% in the second survey. The input assumption at the 75th percentile of the first survey is 9.79% and the maximum was 10.79%. Our input assumption is 9.00% and our shock input assumption is 10.80% which is in line with the maximum rate in the first survey.
This shows that our 20% increase in rate is in line with the increase compared with the range of market discount rate input assumptions.
Prepayment Shock Analyses
To demonstrate the effect of the prepayment speed assumption on the overall value, we developed two shock analyses. In the first example, we simply increase our prepayment speed assumption by 20%.
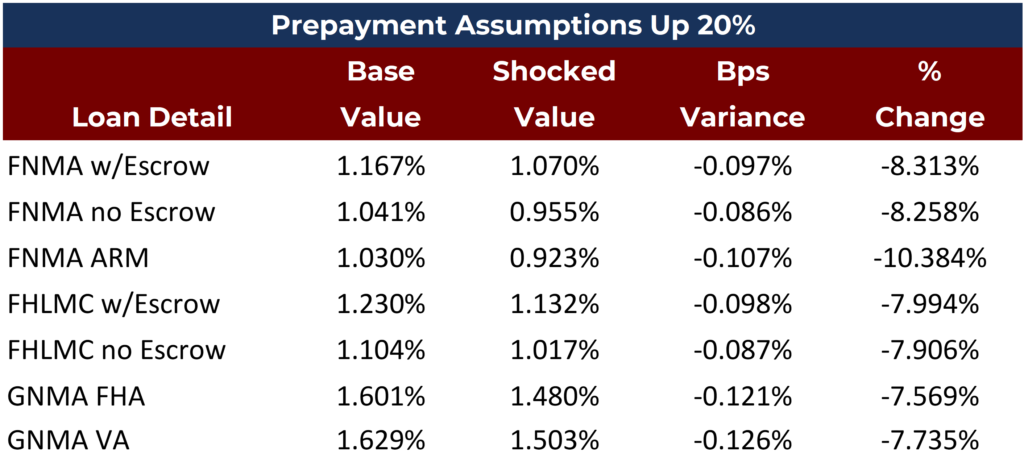
The results show that the prepayment speed input has a significant effect on the MSR fair value.
In the second example, we assume that market interest rates fall by one-half of one percent. The table below shows the base prepayment assumption and the assumption if rates fall 50 basis points using the market prepayment speeds from the MIAC model. In the example below, if interest rates decreased 50 basis points, the prepayment rate for the sample FNMA and FHLMC fixed rate loans would increase from 12.218% to 19.418% (an increase of 7.200% or 58.9%).
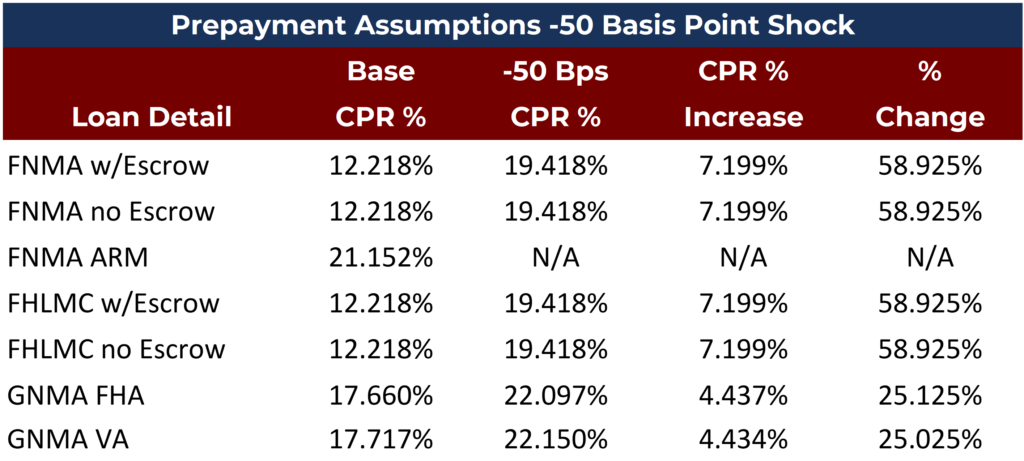
The interest rate shocks are assumed to be an instantaneous, parallel, and sustained shift in the yield curve. The assumed decrease in interest rates and the corresponding increase in prepayment speeds has the following effect on MSR values.
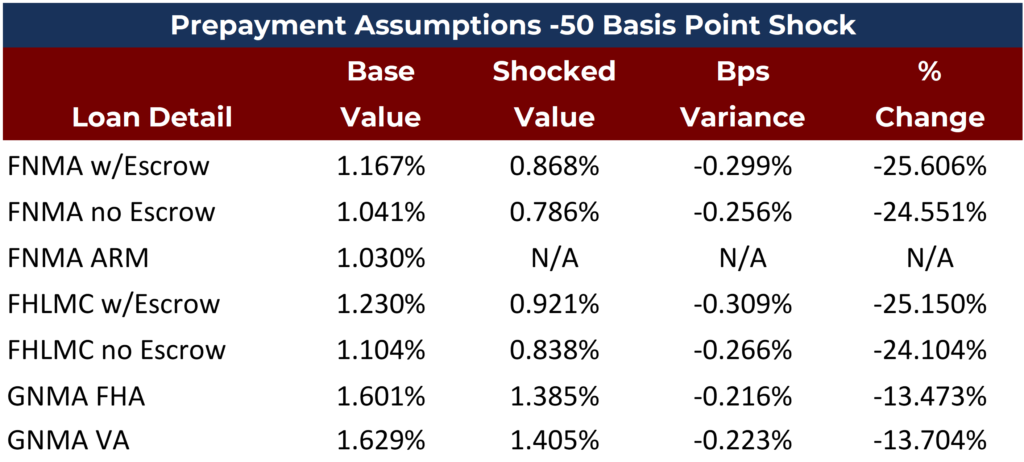
The results show that even a modest decrease in market interest rates has a significant effect on the prepayment speed assumption, increasing the speeds by more than our 20% shock assumption and significantly changing the overall value of the MSR asset. We also note that this impact is related to newly originated loans and that the impact on most existing MSR portfolios with weighted average interest rates less than 4.00% would not be impacted nearly as much by a 50-basis point decline in mortgage rates.
We further note that market interest changes can regularly change by more than 50 basis points. The table below shows the effect of changes in the prepayment speed on the value of the MSR asset from March of 2008 to March of 2023.
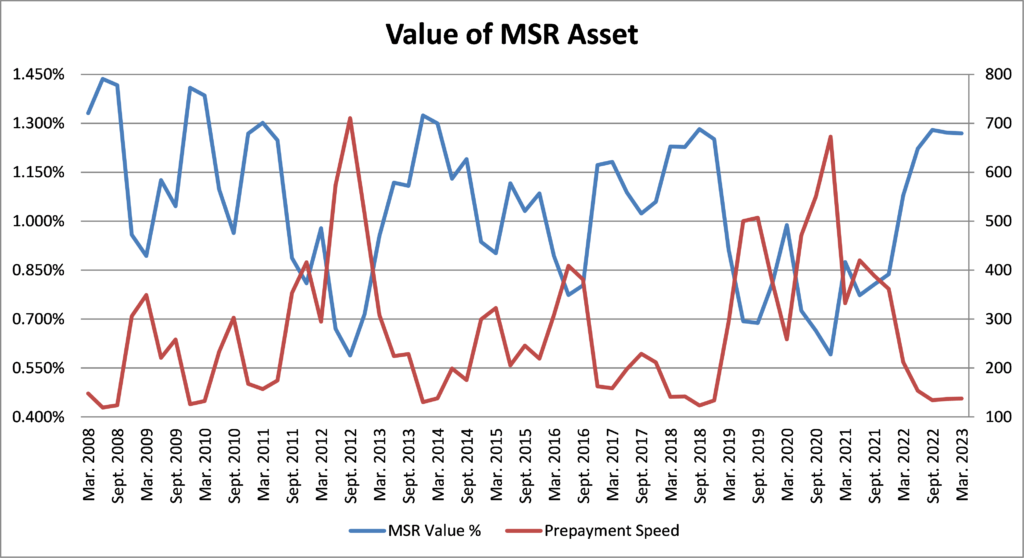
Because the prepayment speed assumption is such a critical input assumption, we routinely include prepayment shock analyses in our valuation reports.
Loan Attributes
In our data requests we ask for numerous loan attributes. An example data request is attached as Appendix B.
Certain attributes are more important than others because the attribute is related to an important valuation input assumption. The most important attributes are related to the prepayment speed assumption and include:
- Loan amount
- Note rate
- Original loan term
- Year of origination
- Investor
- Given the increase in interest rates in 2022, whether the loan is escrowed or not, and the state where the loan is located if it is escrowed.
While we did not shock the servicing fee, it is also an important loan attribute.
Loan attributes with relatively less importance include:
- The investor remittance method
Conclusion
Given the volatility that regularly occurs with mortgage interest rates, it is important for mortgage servicers to understand the impact that these changes have on their mortgage servicing rights assets and the related impact to their financial statements.
Appendices
Please download the full PDF above for appendices.