Non-Maturity Deposits [White Paper]
Key Takeaway
We provide ALM and CECL solutions that help our clients measure, monitor, and mitigate balance sheet risk on an integrated basis. We consider credit, interest rate, and liquidity risk on a holistic basis. We charge a fee for our advice and do not rely on commissions, so we can remain objective. We simply want what is best for our client.
How Can We Help You?
Founded in 2003, Wilary Winn LLC and its sister company, Wilary Winn Risk Management LLC, provide independent, objective, fee-based advice to over 670 financial institutions located across the country. We provide services for CECL, ALM, Mergers & Acquisitions, Valuation of Loan Servicing and more.
Released 2015
Introduction
Non-maturity share accounts are the main source for funding in the industry. They serve as the foundation for establishing and maintaining relationships with members. By virtue of being member-owned, credit unions can offer member benefits in the form of lower loan rates and/or higher share dividend rates. Gaining a thorough understanding of the potential behavior of members with non-maturity balances is therefore of key strategic importance.
Given their concentration, the inputs used to model non-maturity shares are also critical components of effective ALM. This white paper shows the recent industrywide trends of these shares in response to changes in market interest rates. The results can be used by credit unions as benchmarks and for more effective modeling and planning.
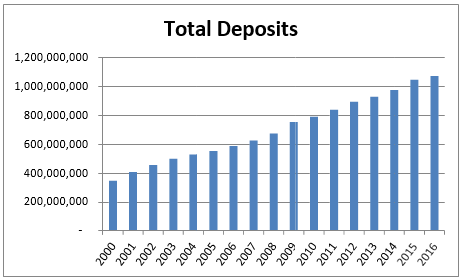
Wilary Winn LLC updated our study of share deposit data from 5300 call reports for all credit unions across the nation. The purpose of our study is to provide industry benchmarks from which to compare non-maturity share assumptions. Our initial study was conducted in 2015 when we analyzed call report data from the 1st quarter of 2000 through the 4th quarter of 2014. We have subsequently updated this study by analyzing call report data for 5,947 credit unions across the nation through the 2nd quarter of 2016. Credit union share deposits play an increasingly important role as a source of financial institution funding. Share deposits in credit unions have grown rapidly since 2000, increasing from $350 billion to more than $1 trillion in 2016. The following graphs illustrate the upward trajectory in credit union share deposits from December 31, 2000, to June 30, 2016.
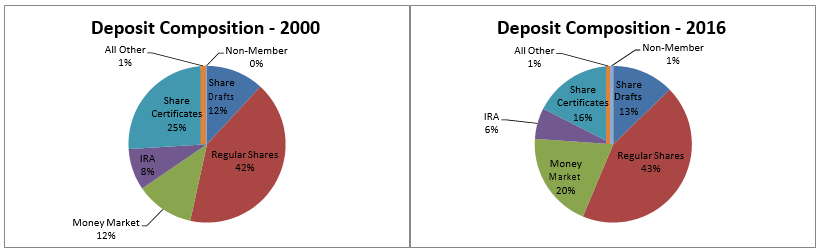
The largest increases in share deposits during the time period studied were in Money Market Shares. Money Market Shares increased from 12% to 20%. Conversely, the percentage of Share Certificates has significantly decreased from 25% to 16%. We believe the increase in non-maturity share deposits combined with a decrease in fixed maturity share deposits is driven mainly by the consumer’s preference for liquidity in the low interest rate environment following the financial crisis. In the following graphs, we can see that the portion of Money Market accounts significantly increased since 2000, while the portions of Share Certificates have decreased.
Importance of Studying Share Deposits
Not only are share accounts at credit unions the main source of funding, but they also serve as a foundation for establishing and maintaining relationships with members. By virtue of being member-owned, credit unions can offer member benefits in the form of lower loan rates and/or higher share dividend rates. Therefore, understanding member behavior is imperative to enhance the business decision-making process for credit unions.
The modeling of share deposits is also crucial to effective Asset-Liability Management (ALM) – the practice of managing risks that arise due to mismatches between assets and liabilities while earning an adequate return. From the ALM perspective, it is easier to model Share Certificates and IRA Certificates in comparison to non-maturing share deposits such as Money Market Share accounts, because Certificate accounts have fixed dividend rates and defined maturities. Share deposit ALM modeling has, thus, become increasingly critical as non-maturity share accounts have grown from 67% of deposits in 2000 to 77% in 2016.
The assumptions used for non-maturing deposits are key drivers in one of the core ALM calculations – net economic value – the difference between the fair value of an organization’s assets and liabilities. Net economic value is a measure of long term interest rate risk which must be managed as part of a successful ALM process. The assumptions used for non-maturity shares also affect other ALM measurements including the effective gap analysis (a report that analyzes an organization’s re-pricing and cash flow imbalances by taking into account the decay assumptions on non-maturity share accounts) and the net interest income earnings simulation.
For these reasons, an advanced understanding of member behavior for business decision making and modeling of deposits for ALM go hand-in-hand. The purpose of this white paper is to illustrate the recent trends in credit union share deposits and help translate these trends into more effective planning and ALM modeling. An additional benefit is to provide industry specific non-maturity share calculation results from the historic relationship between dividend rate and member behavior as a benchmarking source. No matter the size of the institution, a study of the behavior of non-maturity share deposits will help a credit union to not only develop better assumptions for its ALM modeling, but also help it to make more informed decisions related to evaluating potential returns and interest rate risk. For our clients, we utilize the derived assumptions on the behavior of non-maturity deposits from the 5300 call report data for national credit unions as a means to validate individual client assumptions on our on-going ALM and ALM validation business lines.
Share Deposit Assumptions
Forecasting non-maturity share deposit behavior for ALM purposes is difficult because they contain two embedded options:
- The credit union holds the option to determine the dividend rate to offer the member, and;
- The member holds the option to withdraw all or part of the account balance at par.
To model non-maturing shares deposits for ALM, credit unions must make assumptions on member behavior and future dividend rates. Non-maturity deposit assumptions include:
- Re-pricing beta – the magnitude of change that a credit union would likely make in response to changes in market interest rates;
- Effective maturity – the estimate of when the last cash flow for an account type is projected to occur; and
- Decay – the rate at which balances are being reduced from the account base.
Wilary Winn notes that credit unions are currently offering low dividend rates to members by historical standards. We analyzed dividend rate data for all credit unions included in the quarterly 5300 call reports. The following graphs compare the dividend rate paid on credit union share deposits to the 3- month LIBOR, a benchmark for comparing financial institution funding costs. We note that due to changes in the call report format, quarterly dividend rate data for IRA accounts, Share Certificates, All Other Shares, and Non-Member Deposits were not available prior to January 2006. Quarterly dividend rate data for Share Drafts, Regular Shares, and Money Market accounts are shown from March 2000 to June 2016.
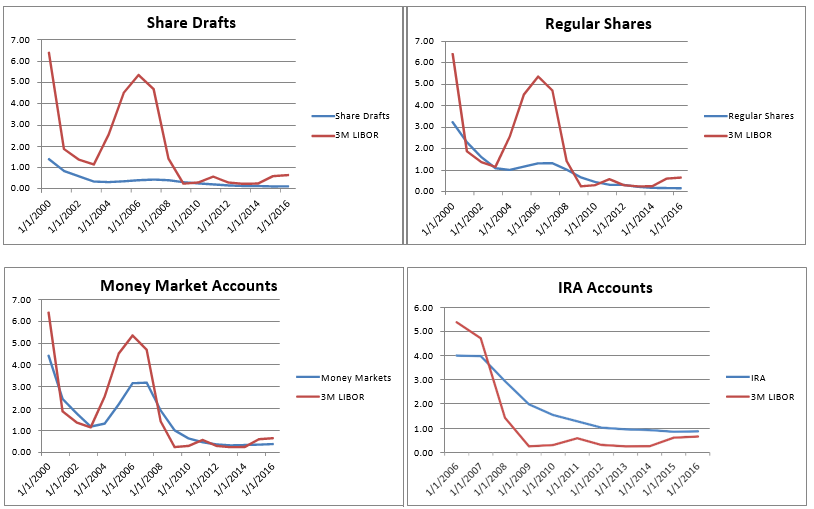
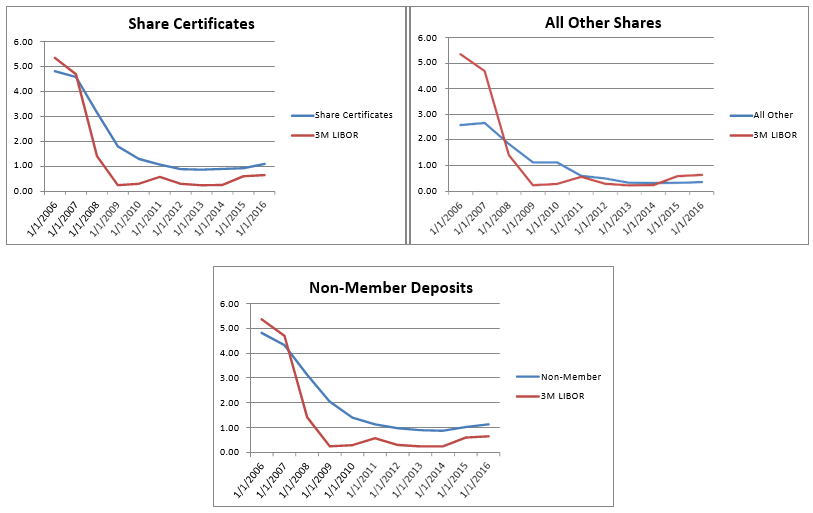
As shown in the previous graphs, credit union share deposit dividends are near historical lows. That said, we note that dividend rates on Share Certificates and Non-Member Deposits did increase slightly since 2014. Dividend rates on all other deposit accounts either decreased or remained the same during 2016.
The historical relationship between offered dividend rates and market rates should be analyzed for ALM modeling purposes. This past relationship is a starting point to forecast the behavior of dividend rates given changes in market interest rates in the future. To determine beta (the magnitude of the change that credit unions would likely make in response to changes in market interest rates), we analyzed dividend rate information as reported in quarterly call reports from March 31, 2000, through June 30, 2016. We then compared the changes in the dividend rate to changes in 3-month LIBOR by performing a linear regression analysis. Because non-maturity dividend rates typically move less than the market, the beta is the percentage change in the deposit rate for every one percent change in market interest rates. Following is the beta for national credit union data calculated in our analysis.
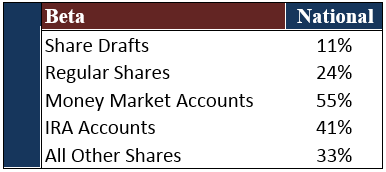
While Wilary Winn fully acknowledges that past performance is not necessarily predictive of future performance, we believe the regression results provide useful context when developing assumptions regarding future rates and that benchmarking individual credit union data to the national results is a useful exercise.
Two other concepts are important in understanding non-maturity deposit behavior – effective maturity and decay rate. The effective final maturity indicates when the last cash flow for an account is projected to occur. It is analogous to the payoff date on a loan. Effective maturity assumptions are important to consider because of the members’ option to withdraw a portion or all of their account balance. One way to model account persistency and determine the effective maturity for non-maturity share accounts is to analyze how they performed in the past. Wilary Winn does this by performing a regression comparing the spread between the historical LIBOR and dividend rate versus the average balance for the account type. The outcome, or R-squared, that results from this regression provides a measure of how well changes in average balances are explained by changes in the spread of the dividend rate to LIBOR, or how rate sensitive members are and their willingness to remove deposits. Following are the estimated effective maturities for non-maturity share deposit accounts for all credit unions included in the 5300 reports for the period we analyzed March 31, 2000, to June 30, 2016.
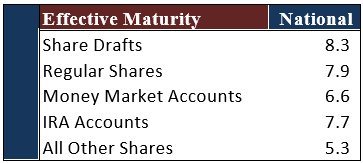
Wilary Winn notes that the flight to liquidity resulting from the Financial Crisis has served to increase the effective maturity calculation. The reaction to the Financial Crisis is embedded in the data analyzed and contains an extended period in which non-maturity share balances increased while offered dividend rates decreased substantially. This serves to increase the effective maturity calculation. As a result, Wilary Winn generally applies a 65% to 75% factor to calculated effective maturities for ALM analysis as a way to normalize effective maturity.
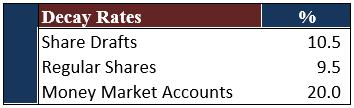
While calculation of beta and effective maturity from 5300 call report data is possible, it is not possible to calculate decay rates. The decay rate is the measure of the decrease in the non-maturity share balance until its final assumed maturity. It is similar to the curtailment rate on a loan. A decay rate assumption is needed for calculating average life. To illustrate the effect of decay rates on the average lives of non- maturity shares, we combined the effective maturities from above with half of the decay rates determined in the National Economic Research Associates (NERA) non-maturity deposit study1. When analyzing individual credit union decay rates, half of NERA decays are a typical result. Following are the decay rates used in our analysis:
The average life results are shown in the following table.
Average lives with 100% effective maturity:
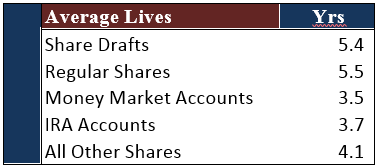
Average lives with 75% effective maturity:
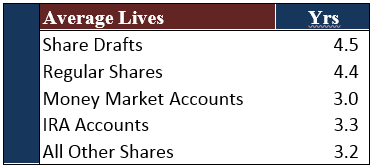
Not surprisingly, Regular Share and Share Drafts reflected the longest average lives while Money Market Shares reflected the shortest.
NCUA NEV Supervisory Test
At the NCUA’s June 16, 2016 board meeting, a new “NEV Supervisory Test” was announced. The supervisory test was created in response to the wide dispersion of non-maturity share assumptions observed by examiners. The NCUA’s goal is to create a standardized approach for all examiners to assess an institution’s non maturity deposits. This supervisory test is also designed to provide a consistent measure of interest rate risk for the credit union industry.
For credit unions over $50 million in total assets, the new supervisory test will establish four risk classifications (low, moderate, high, and extreme) and will include a Post Shock NEV Ratio as well as a NEV Sensitivity limit from the base case to the +300bps rate shock scenario. The parameters of the test include maintaining the base asset valuation and the valuation of term liabilities and using a standardized valuation on the non-maturity deposits. The non-maturity deposits will be valued using a 1% premium in the base case scenario and a 4% premium in the +300bps rate shock scenario. The table below outlines the risk classifications for both components of the test.
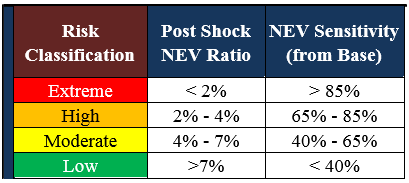
Wilary Winn believes that the NCUA NEV Supervisory Test offers a useful, standardized approach to analyzing interest rate risk between multiple institutions.
However, for optimizing the balance sheet from a business decision perspective, we believe the place to start is with a non-maturity deposit sensitivity analysis study. The study enables an institution to understand the unique deposit behavior of its members. Gaining a thorough understanding of non- maturity share deposit behavior including betas, effective maturities, decay rates, and surge balances will lead to better modeling assumptions and more effective ALM. Ideally, this study is benchmarked to industry sources. Just as importantly, by better understanding deposit behavior a credit union can make better decisions for the long run and provide appropriate levels of benefits in the form of dividends to its member owners.
Endnotes
- Ellis, David M., and James V. Jordan. “The Evaluation of Credit Union Non‐Maturity Deposits” National Economic Research Associates, 2001. ↩︎