Predicting Credit Losses
Discounted cash flow analysis is a common valuation technique and Wilary Winn uses this approach for nearly all of our services.
To project lifetime cash flows for a loan, we need to both estimate its expected life and project total credit losses. The life of the loan is based on its normal amortization schedule along with expected prepayments and liquidations. We use current credit scores, loan interest rates, market interest rates, delinquency status and current loan-to-value ratios (LTVs) to estimate the likelihood a loan will prepay or default. If we expect the loan to default, we also calculate the expected loss on the default based on costs to repossess / liquidate and the collateral value. This calculation drives out lifetime expected losses per loan. We convert lifetime loss estimates to annual loss estimates based on the average life of the loans in the portfolios we analyze. For example, the graph below compares our prospective estimate of losses to the losses actually incurred. The 2014 data is based on over $7 billion of loans on 12 credit unions.
When we first started performing our annual analyses of loan portfolios as of 12/31/08, we expected the average annual loss on first mortgages to be 0.85%. At the time, many of our clients viewed our estimate as too conservative given that their loss rates in recent previous years averaged well under this rate. Our clients experienced actual losses of 0.92% in 2009. As shown in the graph, our predictions for the following two years were nearly identical to the actual results our clients experienced and far in excess of their annual loss rates prior to 2009.
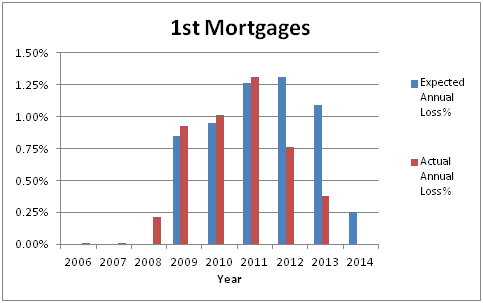
Our predicted annual losses for 2012 remained near our 2011 expected amounts. While the housing market was showing some recovery and experts began to predict robust appreciation, we were hesitant to lower our loss estimates until we had better evidence of the improvement. Most of the loans in the portfolio we analyzed are located in California. While we reviewed reports from expert economists indicating short-term appreciation starting in 2012, we were hesitant to incorporate this full appreciation amount into our future loss calculations. After all, California as a whole had experienced a 4.6% decline in purchase home values over the previous 4 quarters and our clients had yet to see any improvements in the estimated LTVs in their portfolios. However, at the same time, our clients were also working to improve the credit quality of their portfolios. Many instituted stricter underwriting standards resulting in better performance. Throughout 2012, unemployment rates decreased and housing prices started to rebound. At the end of 2012, we lowered our expected average loss estimates to just over 1% in 2013 while the actual losses trended even lower.
We note our clients’ success in restructuring troubled loans skews the comparison between our forecast and the actual loss rates incurred. Many of the portfolios we analyzed at the end of 2012 included significant TDRs with the majority of the TDR loans “underwater”. One portfolio in particular had a nearly 9% 30+ day delinquency rate and LTVs in the 130% range. The estimated LTVs in the overall portfolio also had not improved significantly, with an 84% average in 2012 vs 88% average in 2011. In addition, we were again hesitant to incorporate the full expected housing appreciation into our 2013 forecast and actual losses came in lower than our forecast.
When we analyzed the actual results in 2013, we saw that LTVs had fallen by 12 percentage points to an average of 72%, delinquencies were down by 15%, and credit scores increased to an average of 750. The TDR portfolios were showing improvement and borrowers were finally above water on their homes. Based on these observations, and the market as a whole, we felt comfortable predicting of 0.25% for these portfolios in 2014, slightly lower than the previous year’s actual credit losses of 0.38%, but still higher than the pre-crisis rate of nearly zero.