The State of CECL in 2024 [White Paper]
Key Takeaway
Credit quality metrics at financial institutions declined in 2023, but loss reserves across the industry did not necessarily increase as much as expected. This emphasizes the need for a CECL model that is prospective in nature and can adapt quickly to new environments.
Who is Wilary Winn?
Founded in 2003, Wilary Winn LLC and its sister company, Wilary Winn Risk Management LLC, provide independent, objective, fee-based advice to over 600 financial institutions located across the country. We provide services for CECL, ALM, Mergers & Acquisitions, Valuation of Loan Servicing and more.
Released April 2024
Introduction
The Current Expected Credit Losses methodology, better known as CECL, requires companies to determine estimated lifetime credit losses and record an appropriate lifetime loss reserve when a financial asset is introduced to the balance sheet.
For SEC filers, the CECL standard became effective as of January 2020. For all other public business entities and private companies, the CECL standard became effective as of January 2023.
Many valuation techniques are permitted in determining the Allowance for Credit Losses (ACL) under CECL, including discounted cash flow, weighted average remaining maturity, and vintage analyses. Each methodology incorporates future performance expectations, as required by CECL, into the ACL calculation in different ways.
The economic landscape has shifted since January 2023. Heightened loan delinquency rates and charge-off rates have materialized following years of strong credit performance. In this white paper, we show how the increases affected lifetime loan loss reserves.
Diminishing Asset Quality at Financial Institutions
Loan losses declined at financial institutions in 2021 and 2022 by nearly 50% from the previous several years following the onset of the COVID-19 pandemic. Assistance to borrowers, such as Economic Impact Payments from the federal government and the option to request forbearance of loan payments, helped consumers remain current on their loan payments and reduced the amount of loan defaults across the industry. When combined with rapidly appreciating home and vehicle values, total net charge-offs fell to lows in 2021 and 2022 not seen in the last 40 years.
However, the industry faced a new set of challenges in 2023. Inflation that had ramped up through 2022 continued to eat into consumer savings. Rising market interest rates reduced affordability for large consumer purchases. Home values have stagnated since the summer of 2022, and vehicle values corrected after reaching a peak in December 2021. As a result, loan delinquency rates and charge-off rates at financial institutions returned to and surpassed their pre-pandemic levels.
Loan Delinquency Rates Trending Up
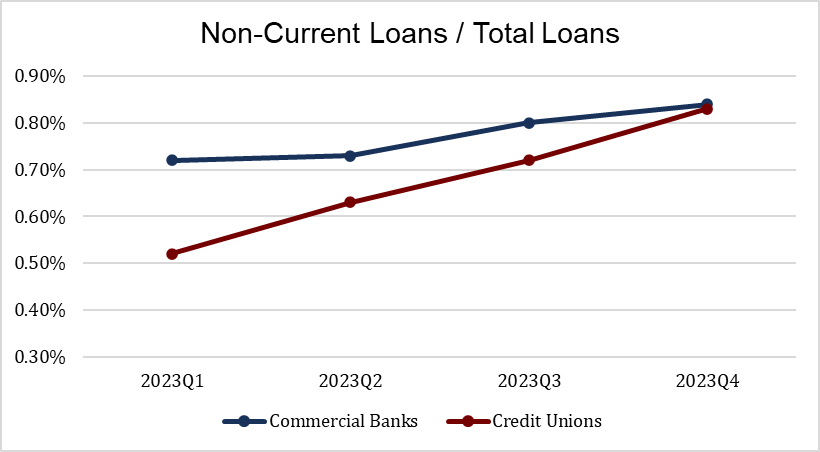
During 2023, loan delinquency rates rose across the industry. Commercial banks experienced a modest increase in non-current loans, increasing from 0.72% of total loans in 2023Q1 to 0.84% of total loans in 2023Q4. Credit union delinquencies totaled nearly the same but incurred a greater change, partially due to having a lower starting point as compared to banks at 0.52% of total loans as of 2023Q1.
Commercial Bank Delinquencies
Delinquency rates for 1-4 Family loans, the largest loan segment, remained generally unchanged during 2023. Instead, the increase in delinquency rates at commercial banks mostly occurred within two primary loan segments: Commercial Real Estate loans and Consumer loans. While other loan category delinquency rates increased as well, these two had the largest overall impact.
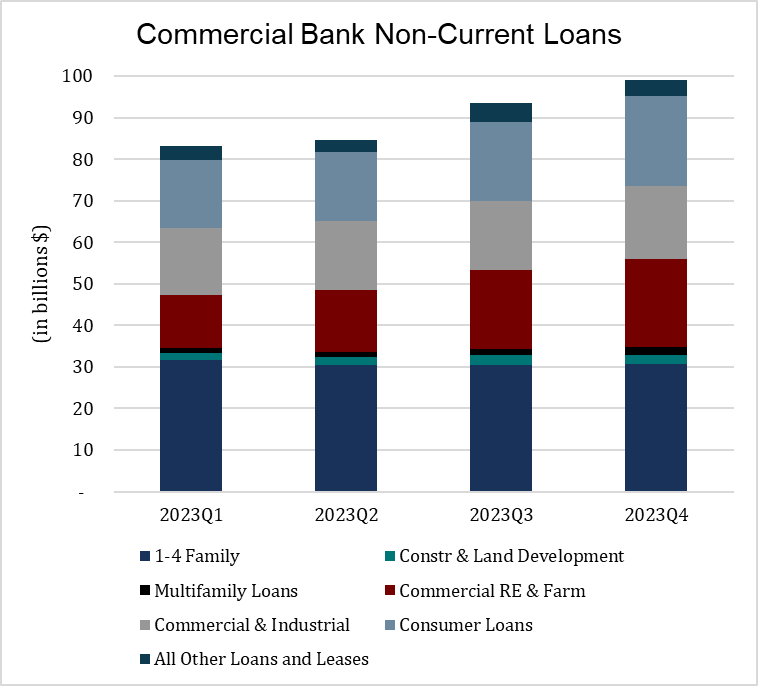
Within the Commercial Real Estate category, owner-occupied commercial loans continued to perform well, displaying low delinquency and charge-off rates. On the other hand, non-owner-occupied commercial loans did not perform as strongly. As an example, total nonaccrual loans of this type increased from $8.10 billion (or 0.75% of total outstanding principal balance) as of March 31, 2023, to $16.18 billion (or 1.46% of total outstanding principal balance) as of December 31, 2023.
Within the Consumer category, the heightened delinquency rates can be almost entirely attributed to credit card performance. Credit card balances at least 90 days delinquent rose from $10.83 billion (or 1.22% of total outstanding principal balance) to $15.58 billion (or 1.55% of total outstanding principal balance) over the course of 2023.
Credit Union Delinquencies
While commercial banks did not experience a material increase in residential real estate loan nonperformance, credit union real estate loan delinquencies rose notably during 2023. The movement was not isolated to real estate loans, as performance for all loan segments worsened over the year. The smallest percentage increase in non-current loans belonged to Other Unsecured loans, which still rose by 36% in balance between 2023Q1 and 2023Q4. Meanwhile, delinquency in both residential real estate loans and vehicle loans nearly doubled over the timeframe, increasing by 96% and 91%, respectively.
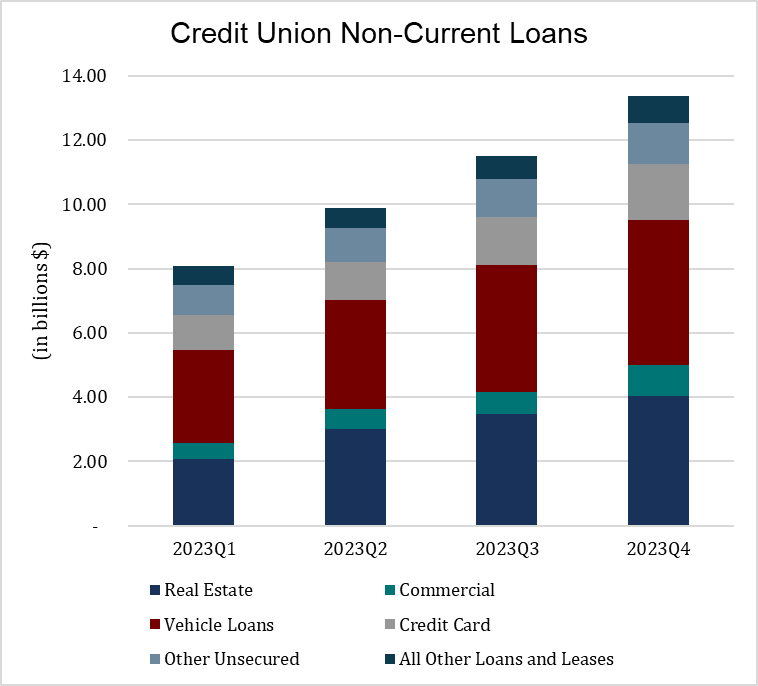
Non-current loans at credit unions totaled $13.37 billion as of year-end 2023, accounting for 0.83% of total loans. This represents the highest level of loan delinquency at a year-end period for the industry since 2016. While the increase in 2023 was noteworthy on a percentage basis, this is partially skewed by a very healthy starting point.
Charge-Off Rates Rising as Well
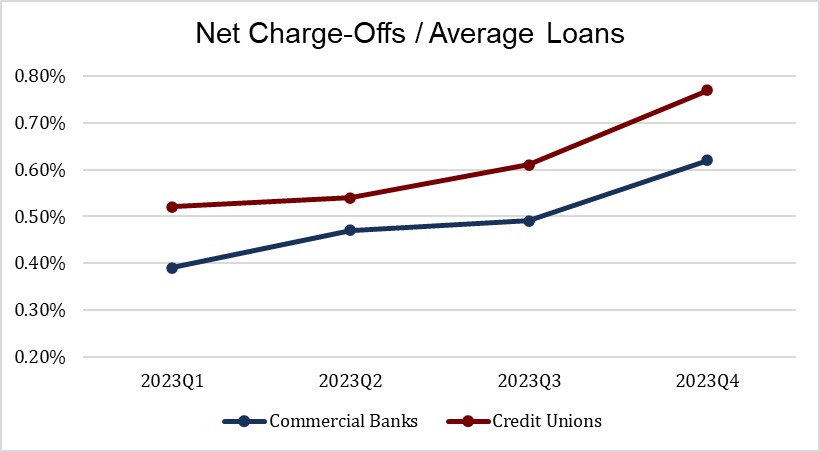
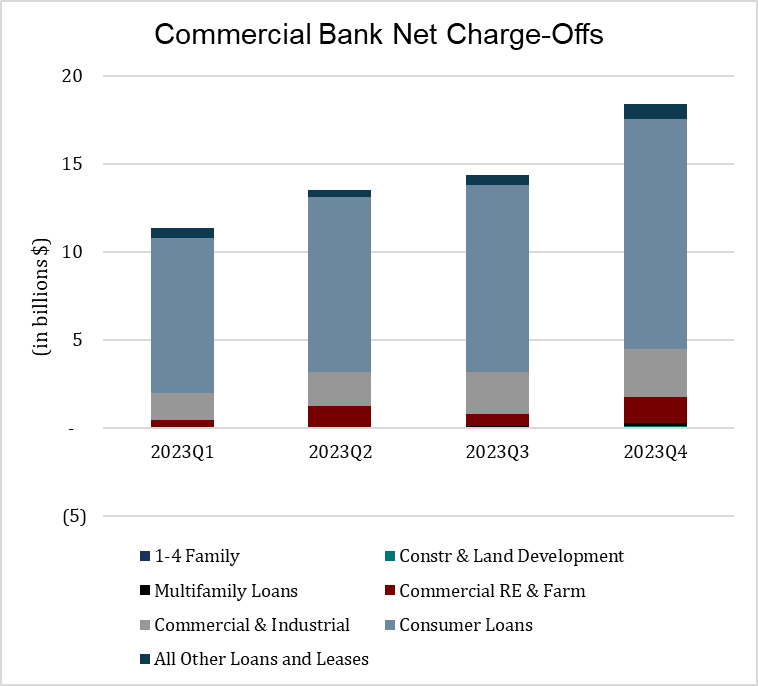
Charge-offs also increased across the industry in 2023. Commercial bank net charge-off rates increased from 0.39% in 2023Q1 to 0.62% in 2023Q4. In total, the average net charge-off rate of 0.50% for all of 2023 was a return to pre-pandemic performance and the highest annual loss rate experienced since 2013.
Similarly, credit unions experienced rising credit losses across the year, rising from 0.52% in 2023Q1 to 0.77% in 2023Q4. The total annual net charge-off rate was 0.61%, which is the highest recorded by credit unions since 2012.
Commercial Bank Charge-Offs
Consumer loans accounted for the vast majority of commercial bank losses in 2023, primarily in the Credit Cards category. Of the $42.46 billion in Consumer loan losses during the year, Credit Cards totaled $32.37 billion, or over 76% of the overall balance. Credit Cards also displayed the most rapid acceleration in losses over 2023, with average loss rates increasing from 2.97% in the first quarter to 4.03% in the fourth quarter.
Meanwhile, despite relatively high delinquency rates, loan losses on 1-4 Family loans remain negligible, and charge-offs on Commercial Real Estate loans have only recently begun to surface. Akin to the trend observed in delinquency rates, Commercial Real Estate loan losses in 2023 were isolated to the non-owner-occupied category. This segment of the aggregate portfolio incurred increased losses, climbing from a 0.14% loss rate in 2023Q1 to a 0.52% loss rate in 2023Q4.
Credit Union Charge-Offs
Credit union charge-offs were more dispersed across the various loan types in 2023 when compared to their bank counterparts. The most significant contributor to credit union losses in the fourth quarter of 2023 was vehicle loans, which rose to just shy of $1.00 billion during the quarter. A combination of falling vehicle prices and a compositional transition towards used vehicles over the past few years, which generally incur higher losses than new vehicles, contributed to rising loss rates within the category.
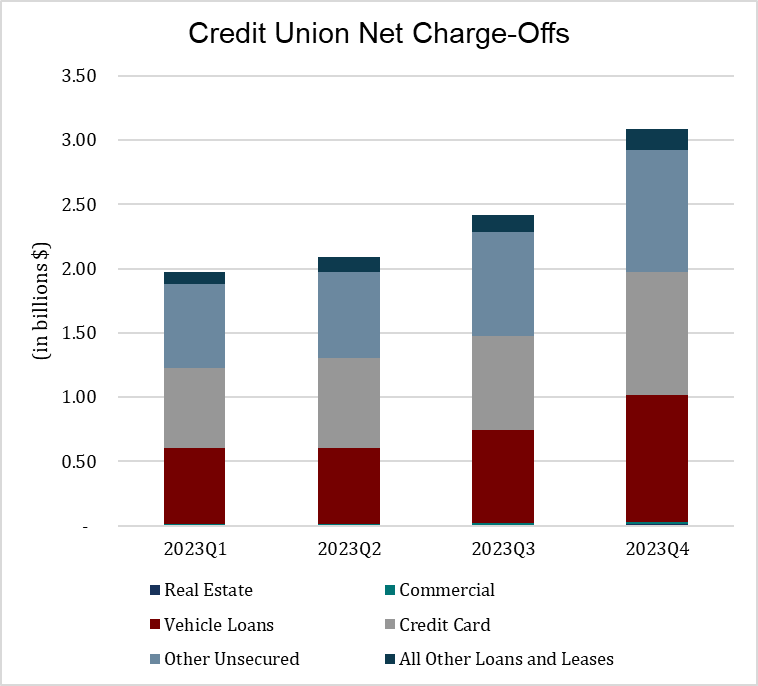
Similar to commercial banks, credit card losses at credit unions resurged in 2023, increasing to 3.88% of average credit card loans during the year. The credit union industry had not experienced an annual average credit card loss that high since the fallout of the 2008 financial crisis when 4.25% of the annual balance was charged off in 2010.
In addition, Other Unsecured loans made up a more substantial proportion of the total charge-off amount. In 2023, credit unions experienced $3.09 billion in Other Unsecured net charge-offs. Over the past few years, more credit unions have established relationships with fintech loan providers, many of which were involved in the unsecured lending marketplace. Losses on these loans were oftentimes much higher than comparable unsecured loans made directly by the credit union. As a result, the overall Other Unsecured loss total increased by $1.51 billion in 2023 when compared to the prior year.
Effects on Loss Reserves
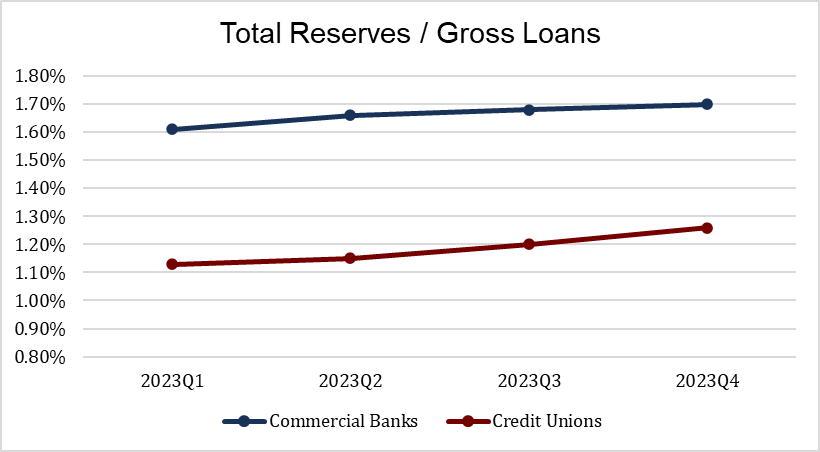
In an environment with mounting delinquencies and charge-offs, financial institutions increased their loan loss reserves only modestly during 2023. Total commercial bank reserves increased from 1.61% of gross loans as of March 31, 2023, to 1.70% as of December 31, 2023. Credit unions responded similarly, increasing total reserves from 1.13% of gross loans to 1.26% over the same period. We note the rising reserves are partially skewed when viewed in aggregate because not all institutions adopted CECL immediately on January 1, 2023. Since CECL adoption aligned with fiscal years and not calendar years, some organizations adopted CECL throughout the year, leading to higher ACLs than would be implied solely by accounting for deterioration in credit quality.
Commercial Bank Reserves
Commercial bank ACLs increased modestly during 2023. In general, banks held healthy reserves at the beginning of 2023 and did not need to aggressively adjust upwards over the course of the year. However, one segment of the loan portfolio was of particular concern for bankers: Commercial Real Estate. Fears surrounding Commercial Real Estate loan performance have existed ever since work-from-home mandates related to the COVID-19 pandemic drove down Commercial Real Estate occupancy rates, especially within select markets and sectors (such as office buildings in large metropolitan centers). Additionally, higher market interest rates are expected to negatively impact businesses renewing their commercial loans, resulting in lower debt-service coverage ratios. The following table highlights commercial bank loan loss reserves by loan type for the four quarters of 2023.

In response to these adverse economic movements, commercial banks increased their reserves related to Commercial Real Estate loans during 2023, climbing from 1.30% of outstanding loan balance as of 2023Q1 to 1.62% of outstanding loan balance as of 2023Q4, representing a 24.61% increase over the three-quarter period. The other loan category reserves mostly remained stable during the year, with the greatest remaining increase belonging to Real Estate Construction loans, and the largest decrease belonging to Residential Real Estate loans.
Credit Union Reserves
Credit union ACLs increased minimally during 2023 as well, though the adjustment did not occur until the fourth quarter. For all credit unions that had adopted CECL in the first quarter of 2023, total ACLs increased from 1.26% of gross loans to 1.32% between the March and December call report cycles, representing a 4.82% increase. If we consider Navy FCU an outlier (having over $170 billion in assets and $4.81 billion in total reserves, which accounted for nearly a quarter of all credit union reserves as of December 31, 2023) and remove them from the population, we observe a similar trend, though to a lesser degree. All credit unions excluding Navy FCU decreased ACLs in the second and third quarters before increasing by 3.24% in the fourth quarter.

While aggregate credit union ACLs increased by 4.82% between March and December, individual organizations experienced a wide array of adjustments.
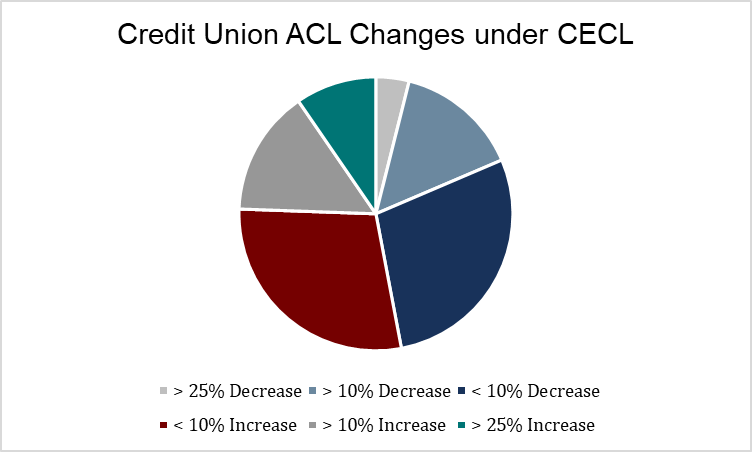
Overall, the majority of credit unions remained relatively consistent in reserving during the year, with 29% of credit unions increasing ACLs by less than 10%, and 28% of credit unions decreasing ACLs by less than 10%. That leaves over 43% of credit unions with ACL adjustments of greater than 10%, either positive or negative. Additionally, nearly 10% of credit unions increased reserves by over 25% between March 2023 and December 2023.
With rising delinquency and charge-off rates, why did credit union reserves not increase by as great a magnitude? Between March and December of 2023, 60+ day delinquencies increased by nearly 60%, and quarterly net charge-offs increased by over 48%; meanwhile, total reserves for credit unions that had adopted CECL only increased by less than 5%. This relationship suggests that credit unions may have been over-reserved in early 2023, under-reserved in late 2023, or somewhere in between.
Using aggregate industry information, we can perform a simplistic Weighted Average Remaining Maturity (“WARM”) calculation to determine what the industry’s total ACL would be if relying solely on 2023’s actual loss experience.

If relying on 2023’s incurred losses and extrapolating to a lifetime reserve, we estimate a total ACL of $20.07 billion for the credit union industry, which is slightly below the actual ACL of $20.43 billion that was recorded as of year-end 2023.
There are two sides to the argument regarding whether or not current reserves are sufficient. The argument supporting the belief that current ACLs are high enough hinges on a reversion to the mean in the future. There is not much reason to believe that charge-off rates in 2024 will be better than those in 2023 based on recent macroeconomic trends, and there could be improvement and reversion to historical averages in 2025 and beyond.
The opposing school of thought offers a few counterpoints. First, the WARM figures shown above are solely based on actual incurred losses and do not make any qualitative adjustments that would likely increase the ACL. For example, residential real estate loans and commercial loans would have very low reserves under this methodology since the actual losses in 2023 for these loan categories were next to zero. This equates to a 0.04% lifetime loss reserve for all these loans, and many institutions prefer to implement qualitative factors as a more realistic and conservative approach. Another reason to think the $20.07 billion figure could be low is the trend of delinquencies and charge-offs. The WARM ACL above is based on the full year’s loss experience, but as described earlier, the loss trend in 2023 was upward sloping, not stable. We are also starting with many more delinquent loans in the portfolio now than previously, which would influence eventual loss rates. Unless the path of loan losses reverses course notably in the second half of 2024, it is reasonable to assume that 2024’s actual net charge-off rates will be worse than those experienced in the past year.
It is also fair to conclude that ACLs may have been inflated at the beginning of 2023 since delinquencies and charge-offs had yet to manifest in the prior two years, yet reserves were seemingly rather healthy and able to absorb the worse 2023 performance. Thus, the answer likely lies somewhere in the middle; credit unions were probably somewhat over-reserved following the onset of CECL, and credit unions may be on the leaner side now after seeing the deterioration that occurred in credit quality over the course of the year.
Conclusion
The trends described in this white paper reinforce the need for a dynamic and prospective CECL model. Without appropriate measures in place to forecast future performance based on current conditions, ACLs at financial institutions might not be representative of an accurate CECL reserve. To have an effective CECL model, key credit indicators should be monitored, such as updated credit scores and loan collateral values, and reasonable adjustments should be made for future expectations of asset nonperformance.